Click to Download Full PDF Here
The following is a summary of a limited topics that CEIS quarterly surveys. The CEIS database includes various other indicators such as grade variances, grade outlooks, covenant compliance, new and renewed characteristics, and other related statistics.
CEIS enjoys a business relationship with approximately 130 commercial lenders of which 65-70% are Community Banks. The remaining are larger banks, foreign branch offices, and other commercial lending organizations.
Portfolio Mix – CRE vs. C&I
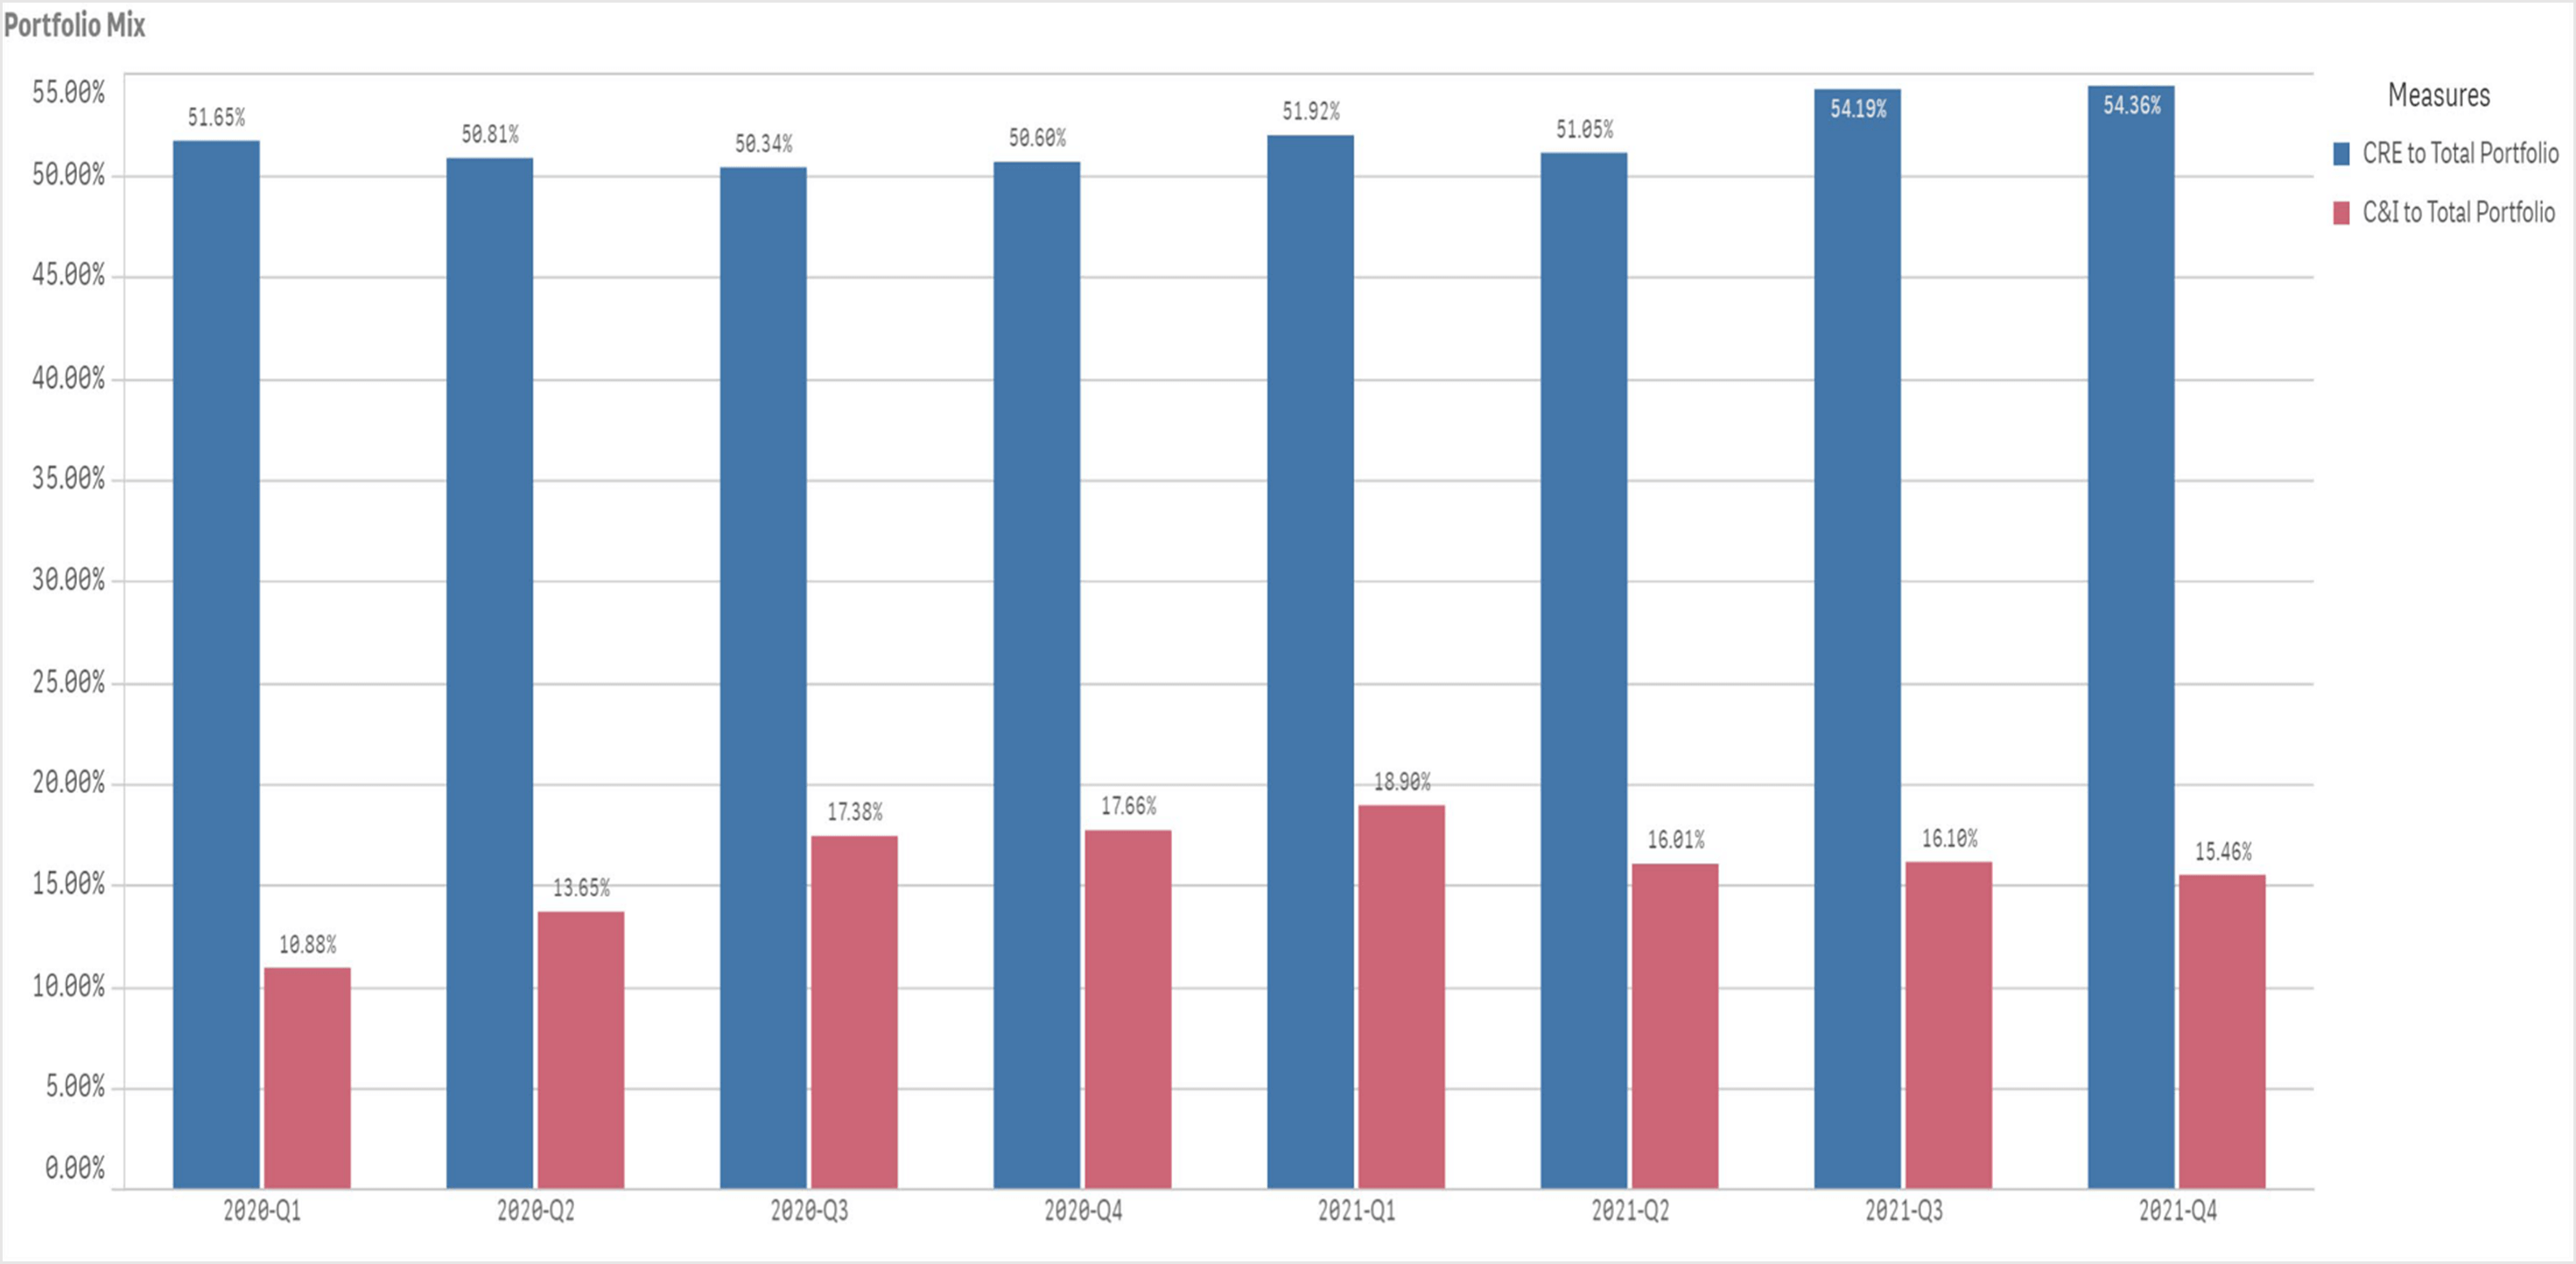
CEIS Reviews Client’s loan portfolios sampled for this analysis are heavily weighted in Commercial Real Estate (CRE) >50% / total portfolio with commercial & industrial (C&I) following at approximately~16% / total portfolio.
CRE Portfolio Mix

Commercial real estate portfolio mix percentages
Non-owner occupied commercial real estate continues to comprise the largest segment within sampled portfolios at 24.94% of CRE, followed by multifamily at 12.45% and owner occupied at 10.88%.
Construction has maintained a level of approximately 5% of total portfolio since 1Q20.
Provisions for Credit Losses, Reserves and Net Charge-Offs
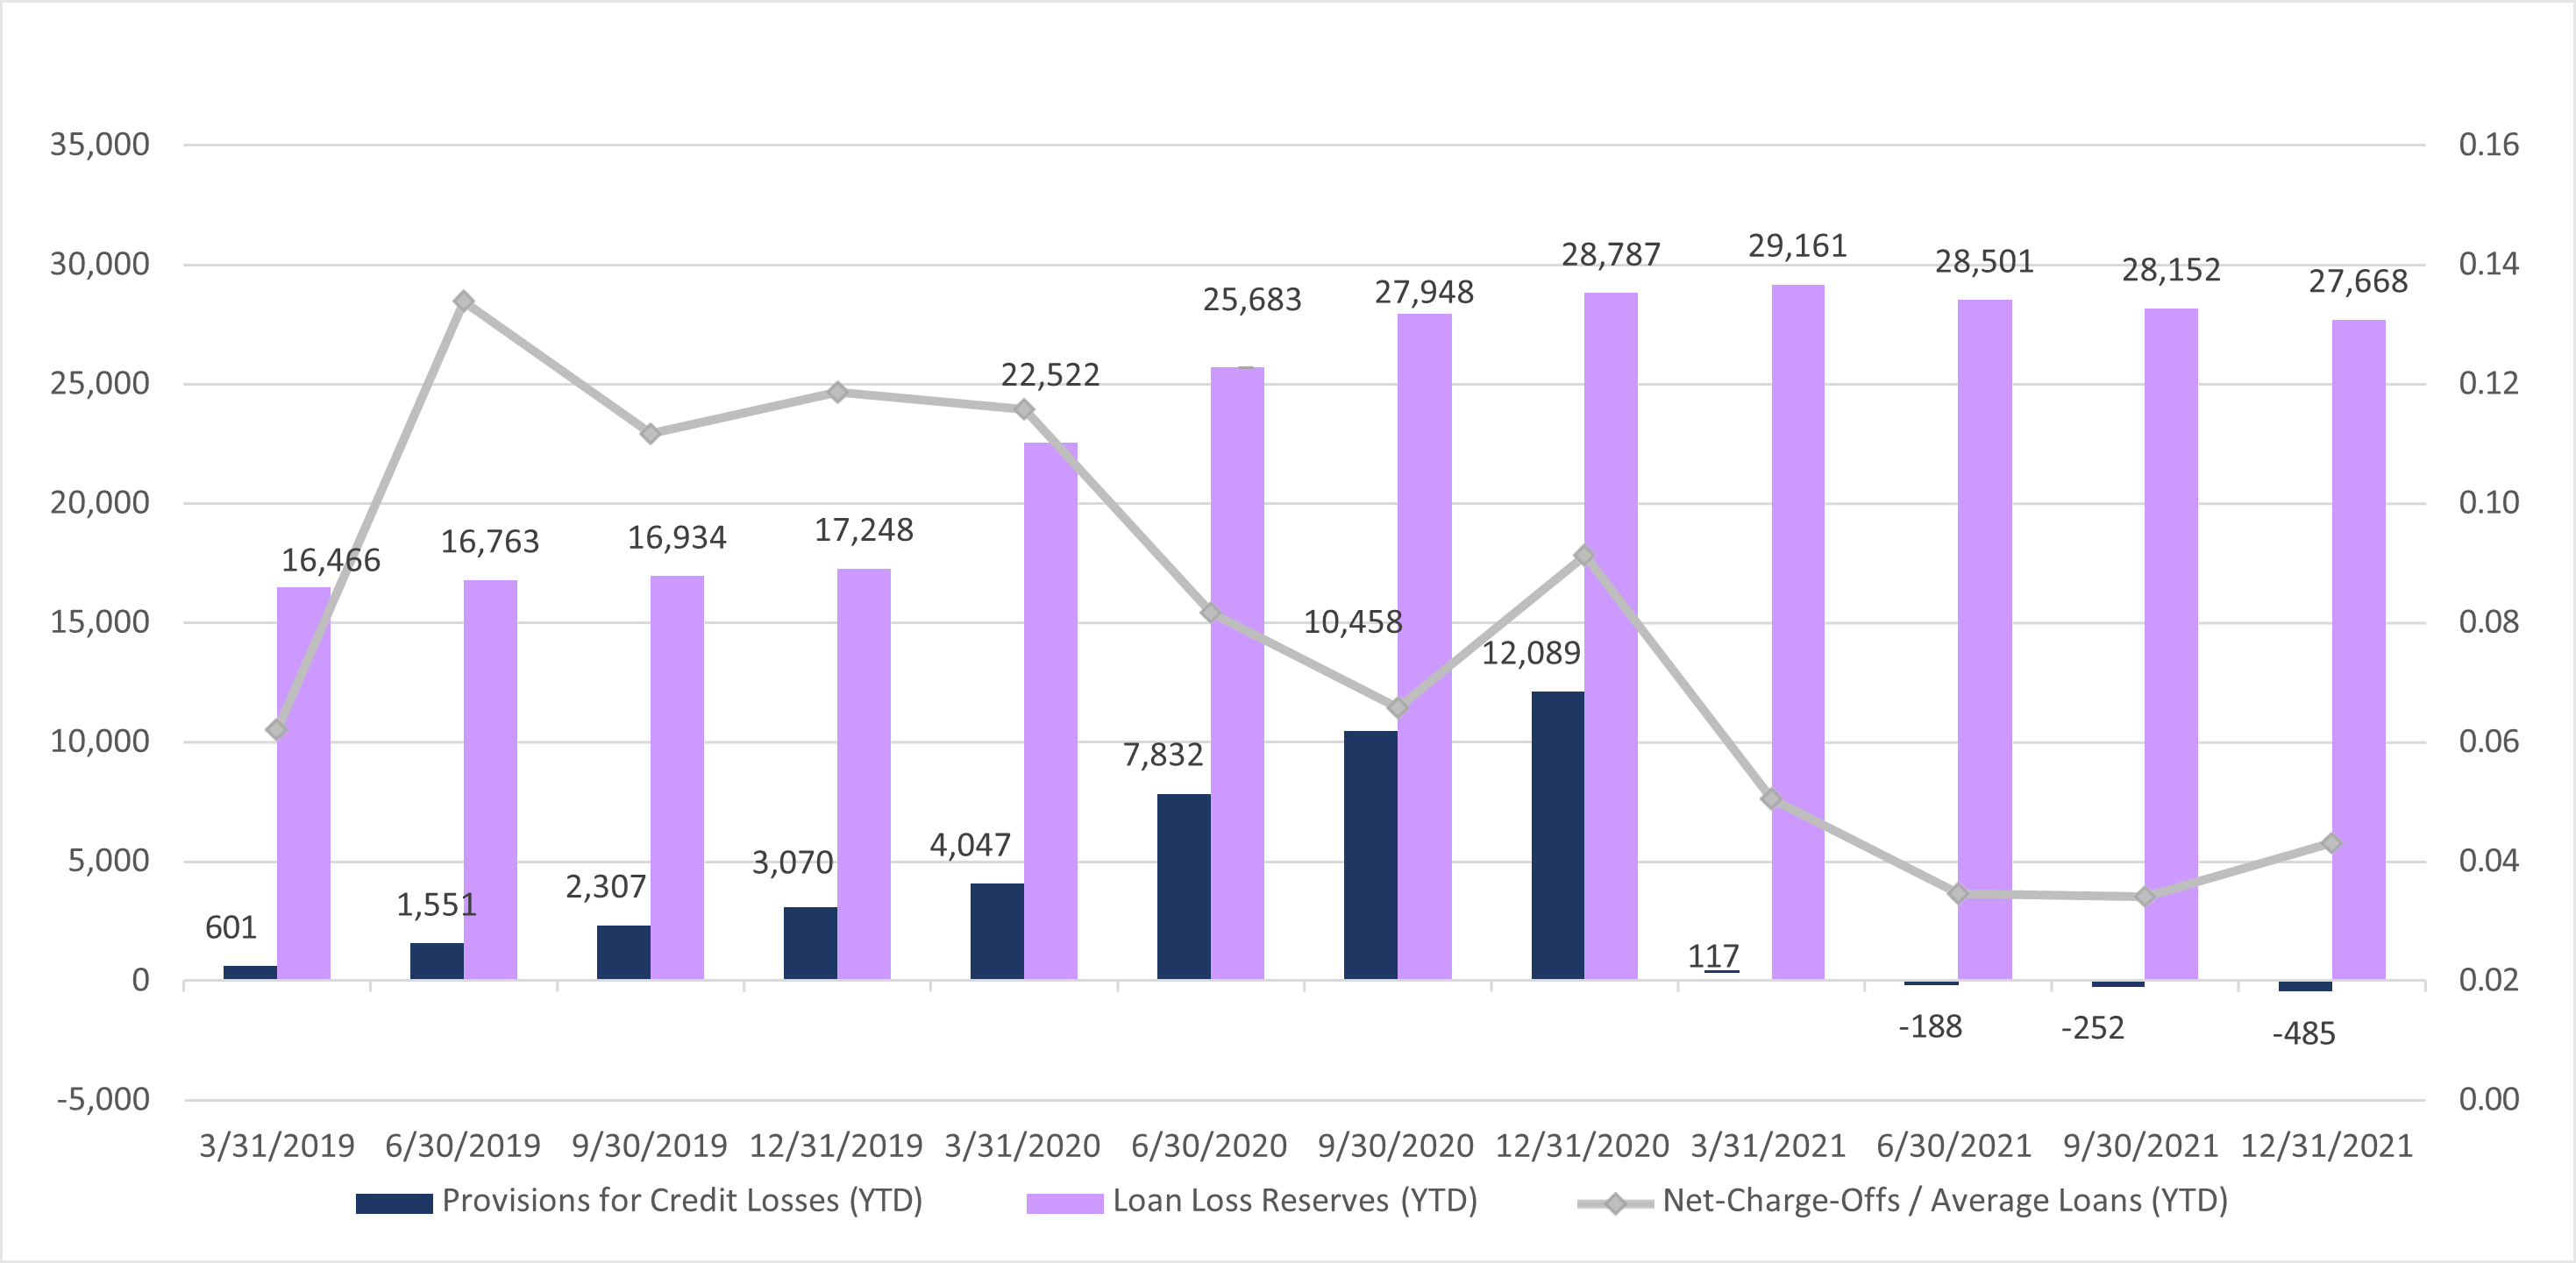
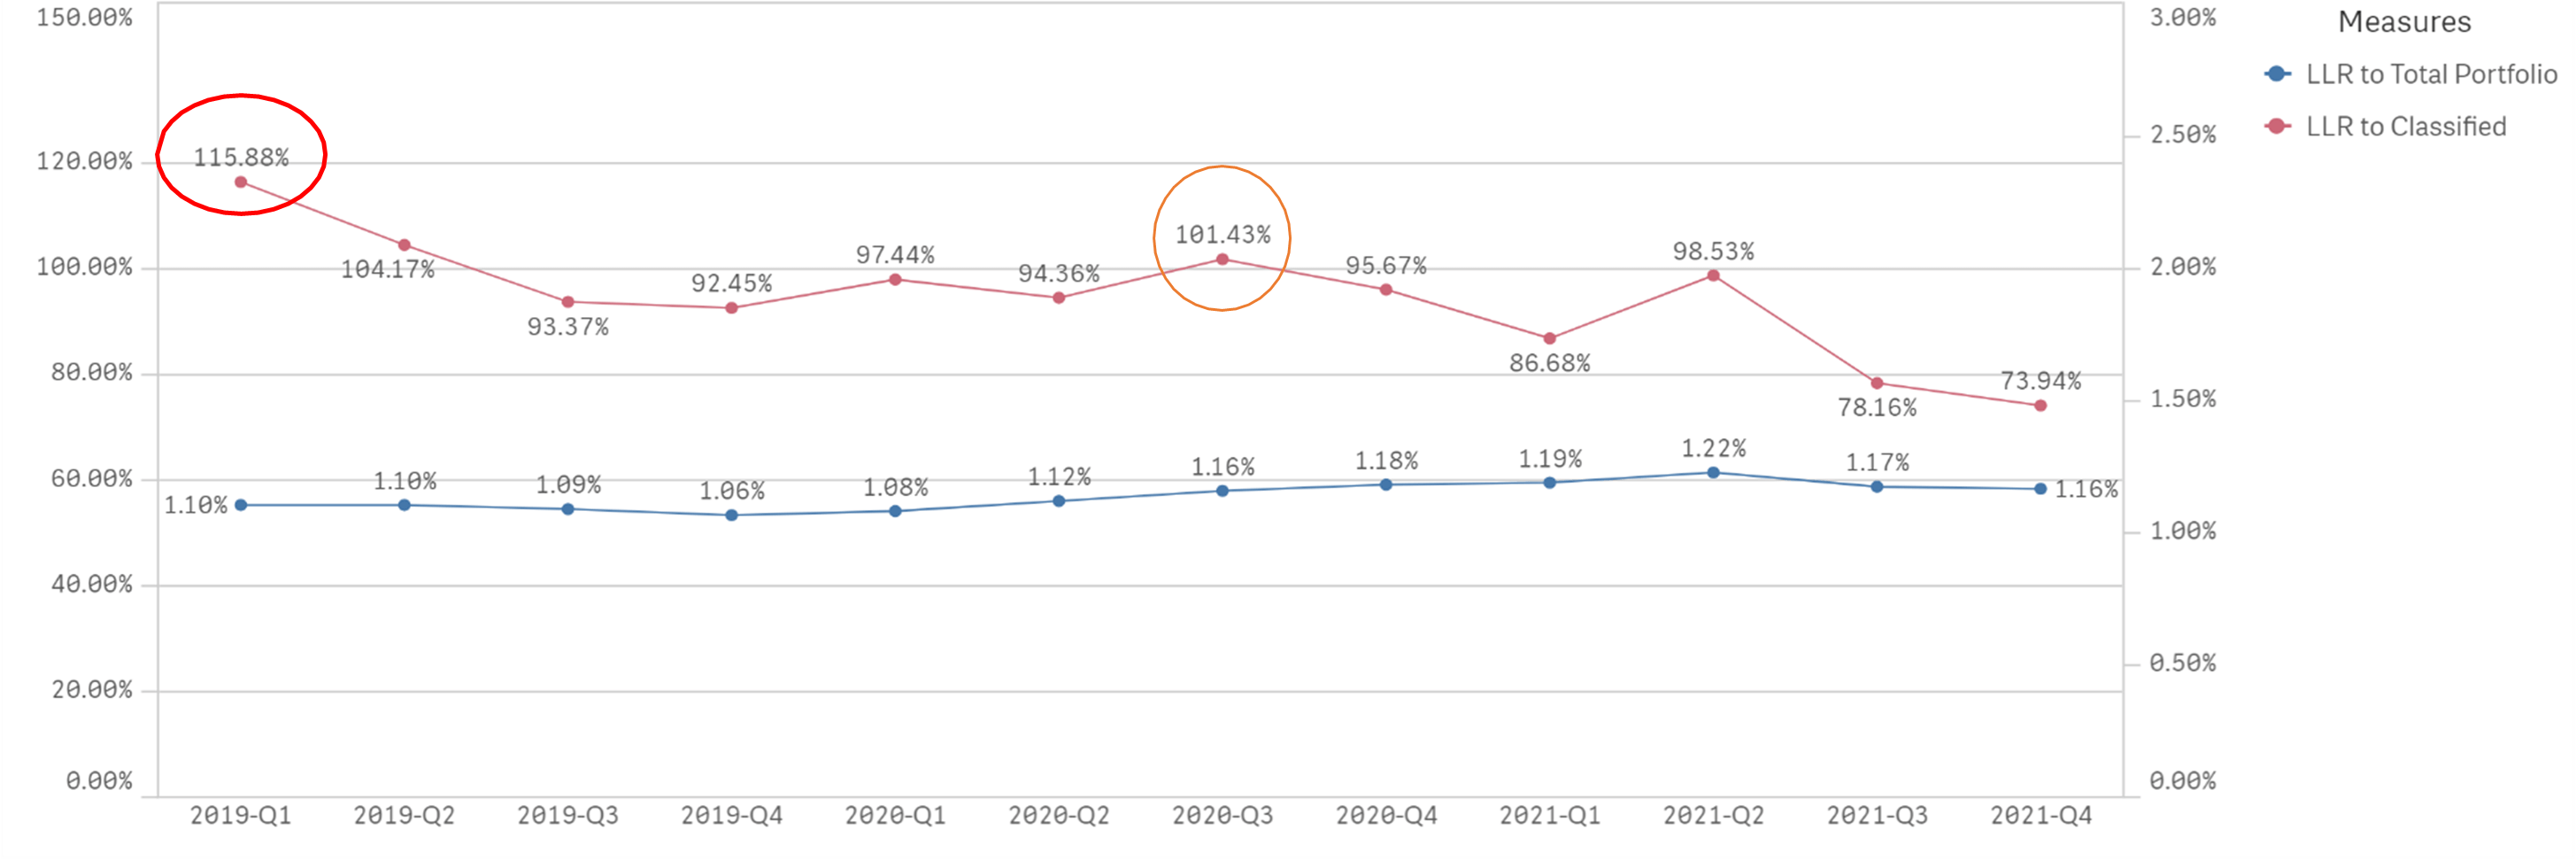
In line with the prior quarter’s findings, provisions for credit losses within CEIS’ Client base have dropped notably since FYE20 with the 4Q21 showing a modestly negative provision.
Loan loss reserves for the group showed a slight decrease while net credit losses increased from an annualized 0.03% at 3Q21 to 0.04% at 4Q21, however these ratios remain well below the 0.09% reported at FYE20.
Reserve Coverage

Loan Quality Indicators
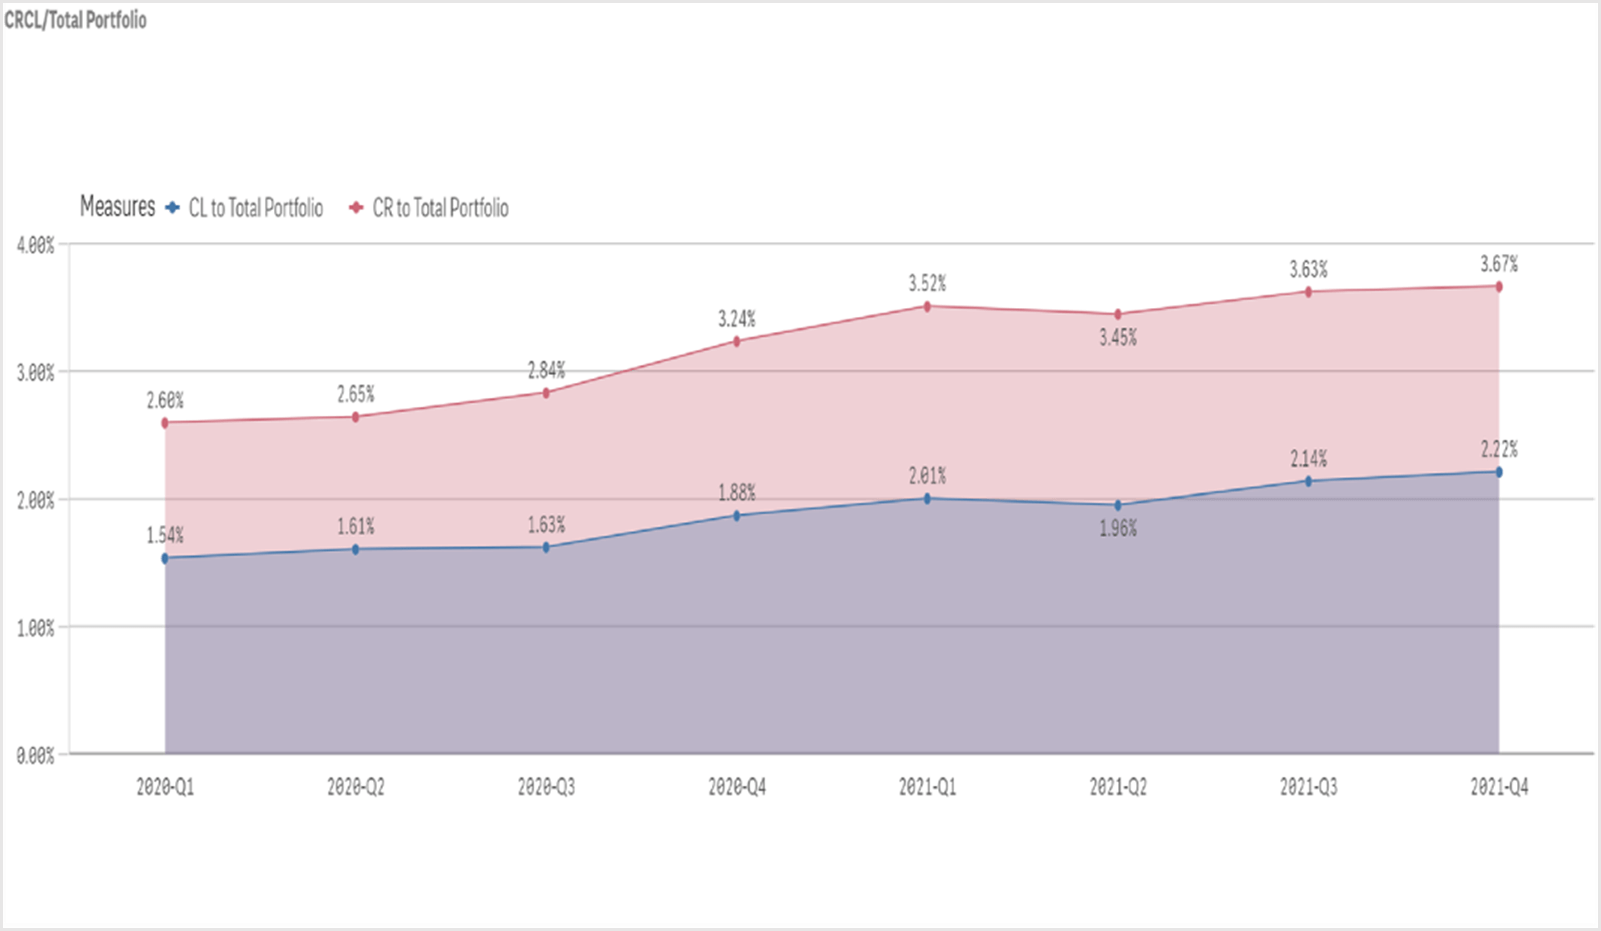
Criticized (Special Mention, Substandard, Doubtful) loans to portfolio represented 3.67% at 4Q21 representing an increase from 3.24% reported one-year prior at 4Q20.
Classified (Substandard, Doubtful) loans relative to portfolio also increased to 2.22% at 4Q21 and was above the 1.88% reported one-year earlier at 4Q20.
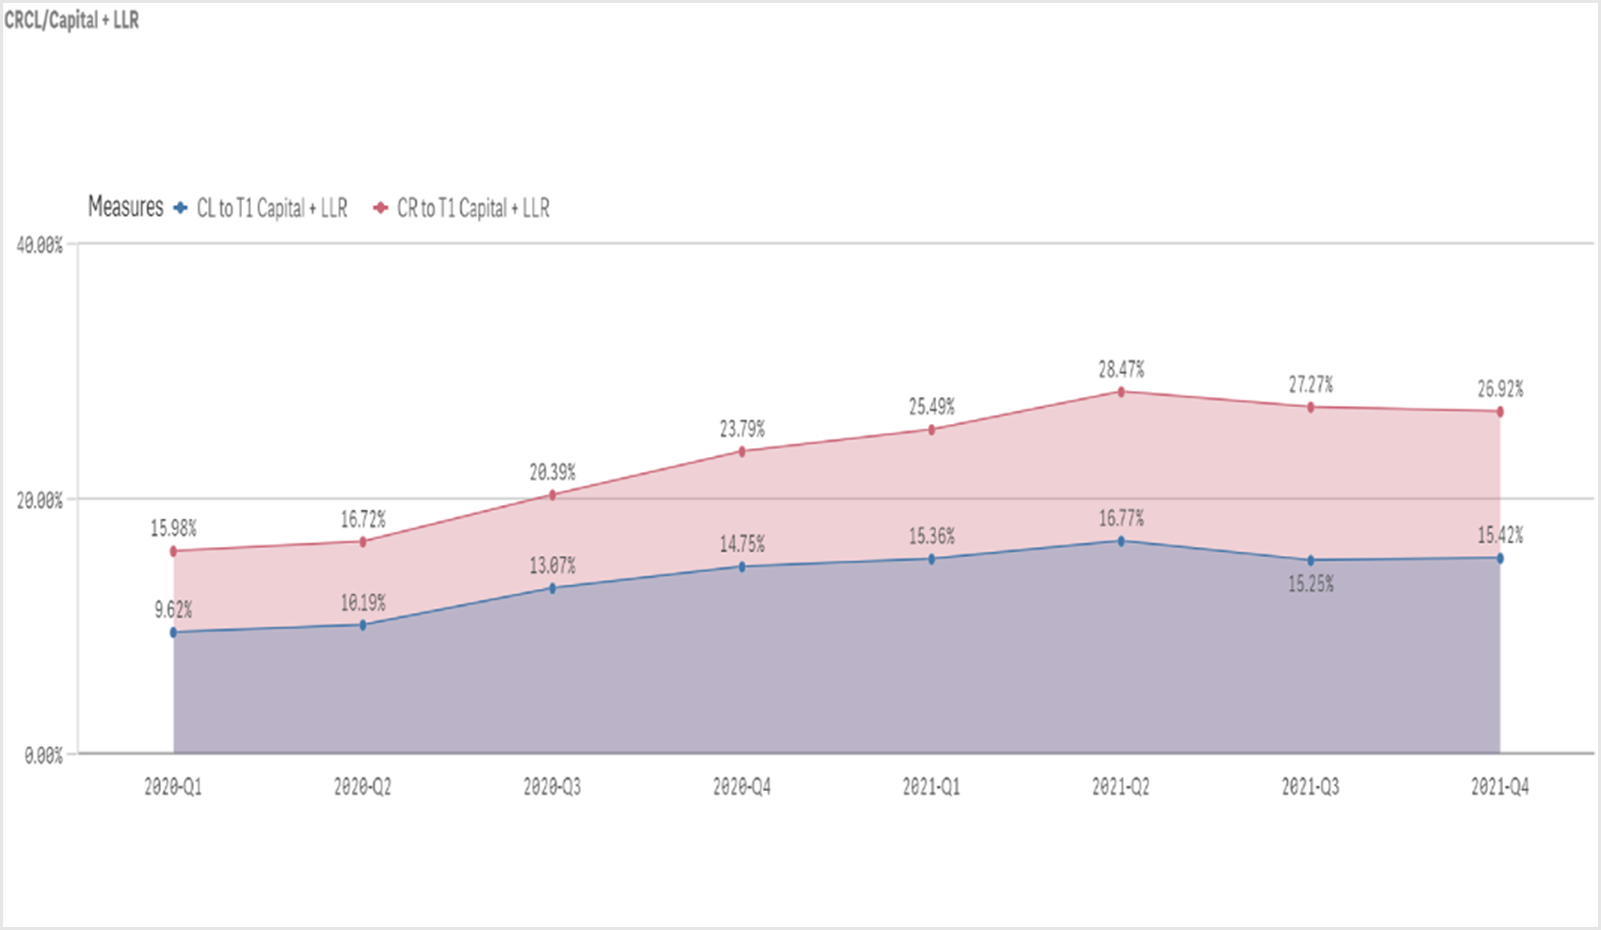
The ratio of Criticized (Special Mention, Substandard, Doubtful) loans to Tier 1 capital plus loan loss reserves was 26.92% at 4Q21, still above the 23.79% reported at 4Q20.
The more critical ratio of Classified (Substandard, Doubtful) loans to Tier 1 capital plus loan loss reserves has increased to 15.42% for 4Q21 remains above the 14.75% observed at 4Q20.
Grade Outlook
The following are CEIS’ estimates of the six-month outlook for assigned Risk Ratings.
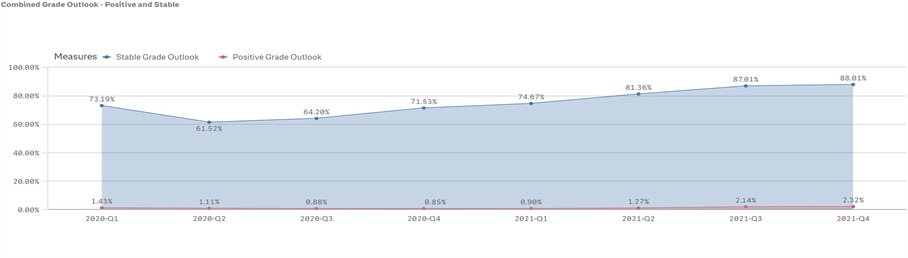
CEIS’ estimates of grade/risk rating outlook have been trending upward since 2Q20 in that the “positive” + “stable” estimates improved since that time while “negative” estimates plus those assigned “insufficient data” available to reasonably determine grade/risk rating outlook have declined.
Exposures estimated to have a “positive” outlook have increased from 2.14% for 3Q21 to 2.32% at 4Q21.The average level of loans estimated to have a “stable” grade outlook increased slightly to 88.01% at 4Q21 from 87.01% at 3Q21 and remains above the 61.52% reported at 2Q20.
Financial Trend – All Loans
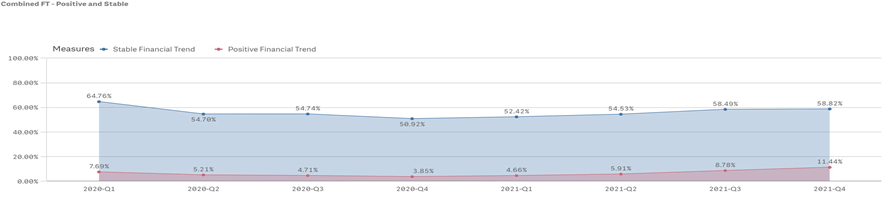
The statistics on financial trends are backward looking determinations based on the most recent financial data provided by the borrowers.
CEIS’ characterization of the financial trends of the borrowers reflect improvement over the prior year with an increased level of loans assigned “positive” or “stable” financial trends while the level of those assigned a “negative” or “ISD” trend have declined. However, the statistics have not returned to the favorable levels typically seen prior to COVID.
Borrowers assigned a “positive” financial trend have increased from 8.78% for 3Q21 to 11.44% for 4Q21.
Prior to shutdowns, 1Q20 showed borrower financial statements being “stable” at 64.76%. Since then, we have seen “stable” financial trends dip to 50.92% for 4Q20, with raises in borrower “stability” experienced throughout 3Q & 4Q21 arriving at 58.82%.
Technical Exceptions
The following represents the pattern on technical exception levels. Over the last four quarters the exception level has remained relatively flat.
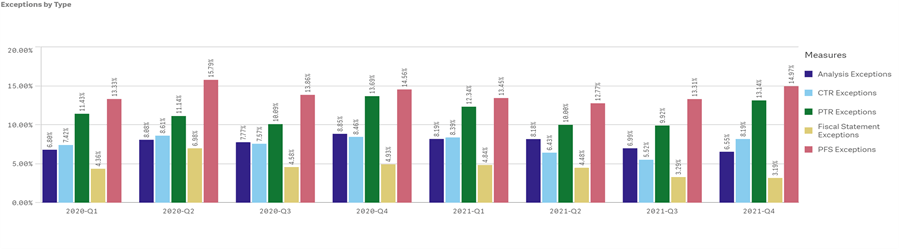
Exceptions related to personal financial statements (PFS) and personal tax returns (PTR) continue to represent the greatest technical exception by types at 14.97% and 13.14% respectively for 4Q20.
Both technical exceptions types represent increases from the levels reported for 3Q21 of 13.31% and 9.92% respectively.
New and Renewed Loans
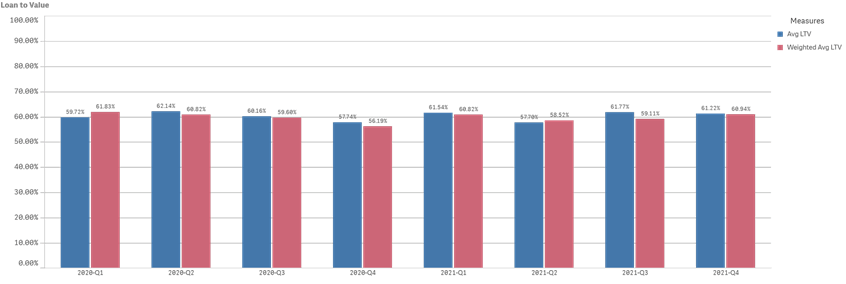
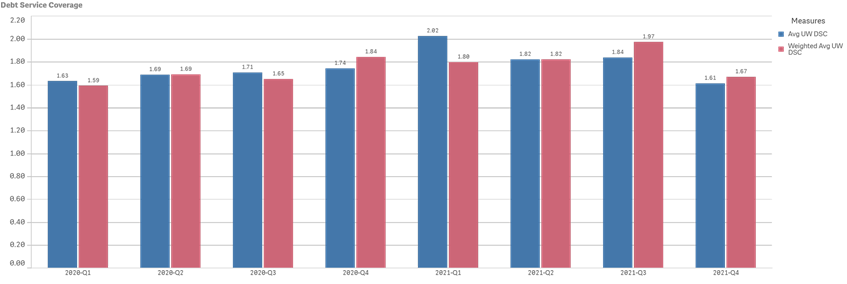
Loan to Value and Debt Service Coverage – CRE
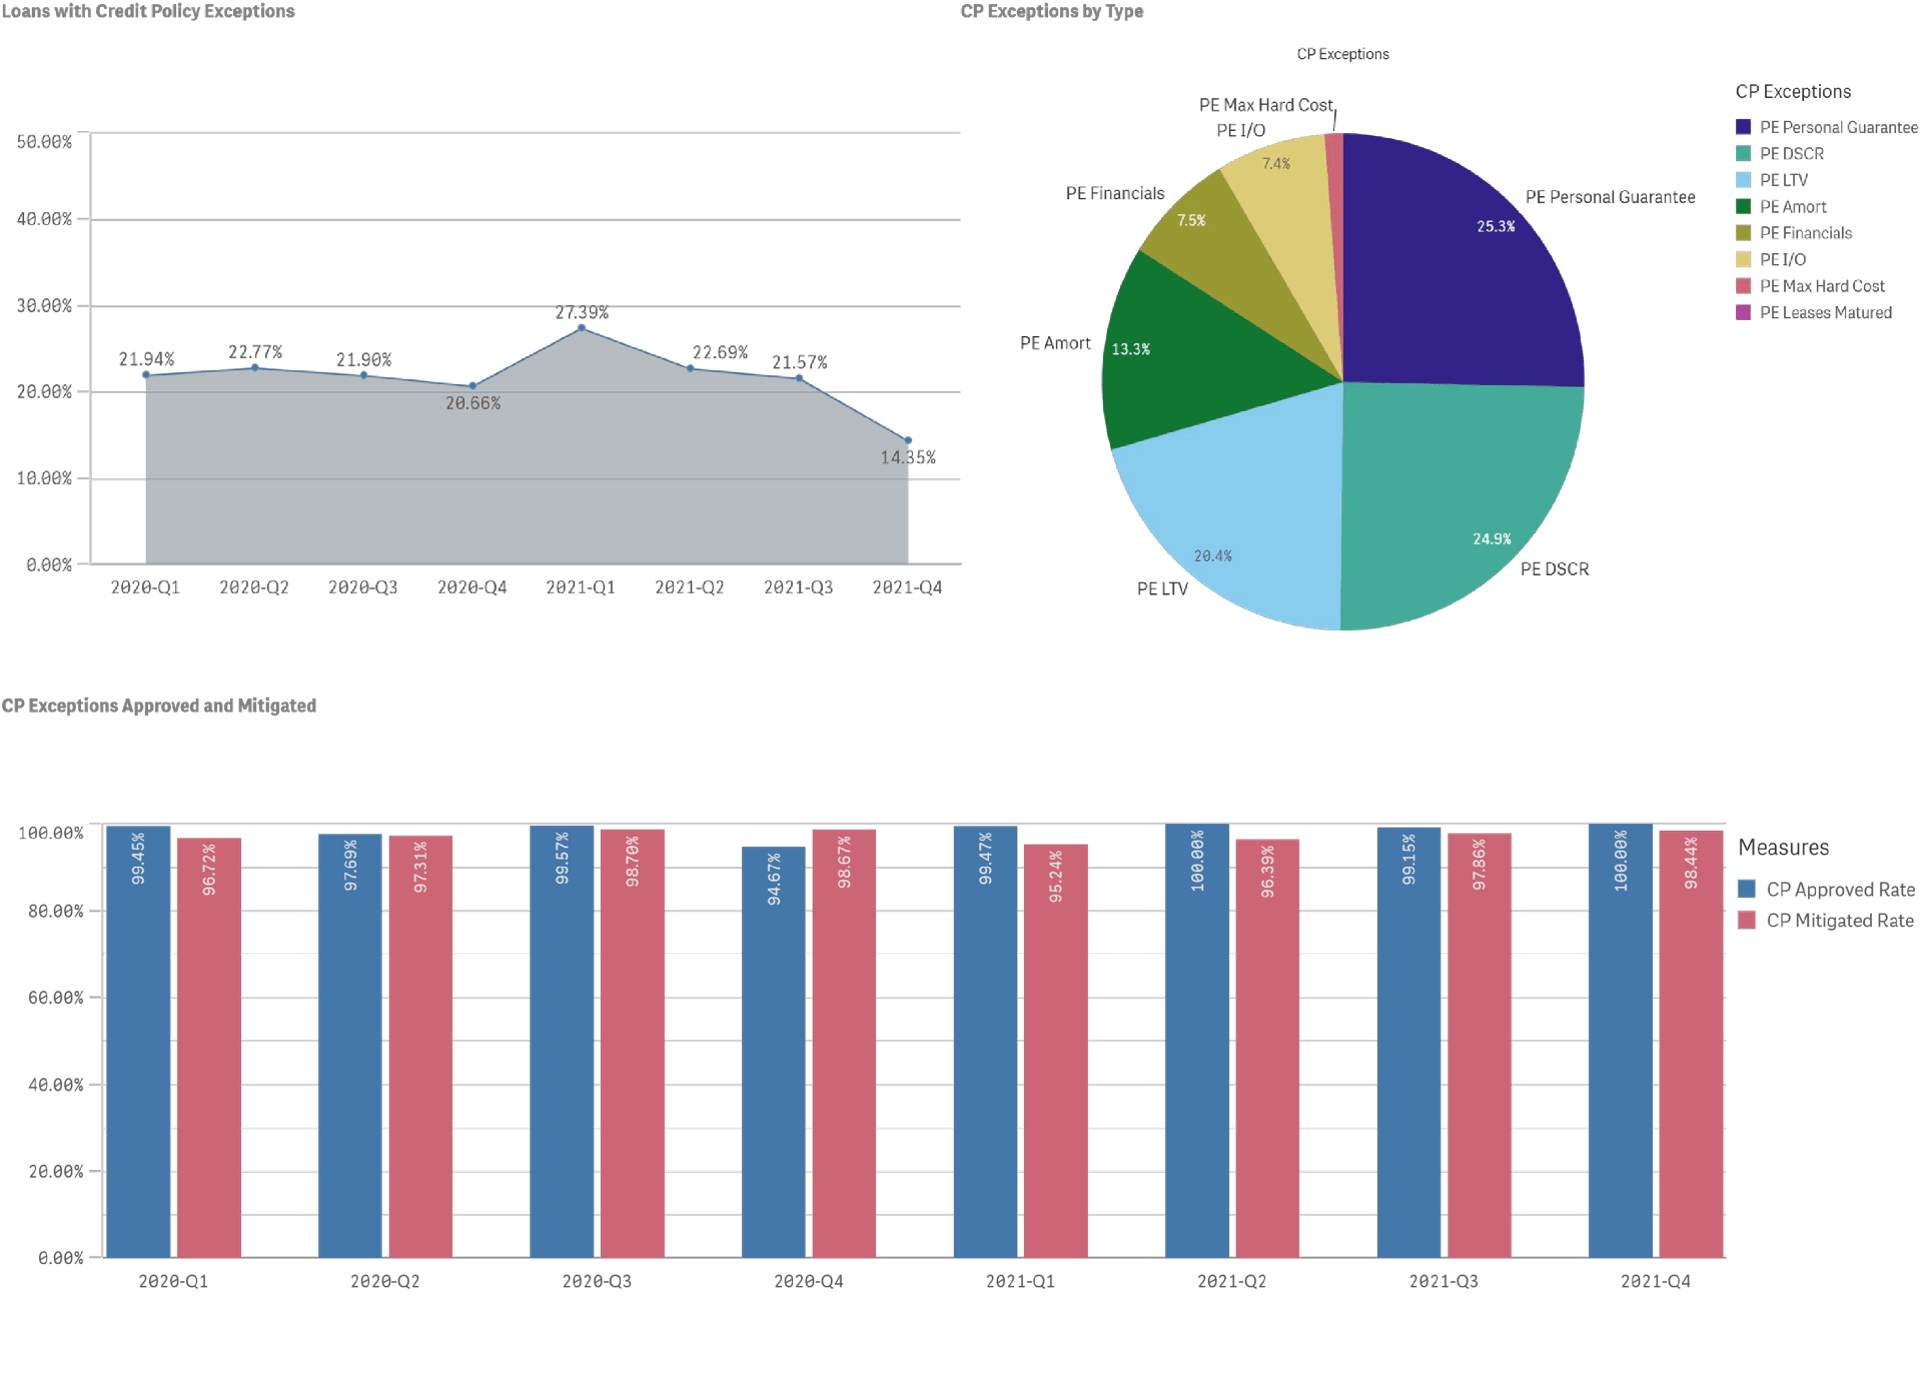
Credit Policy Exceptions
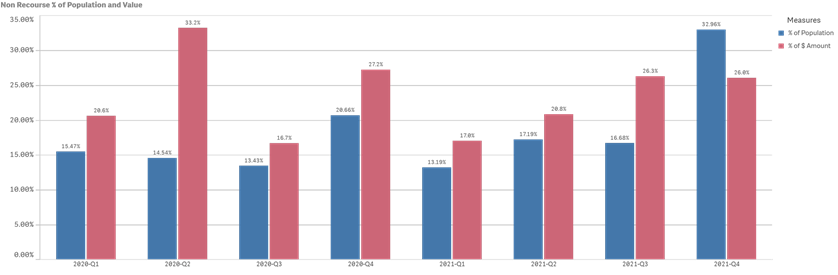
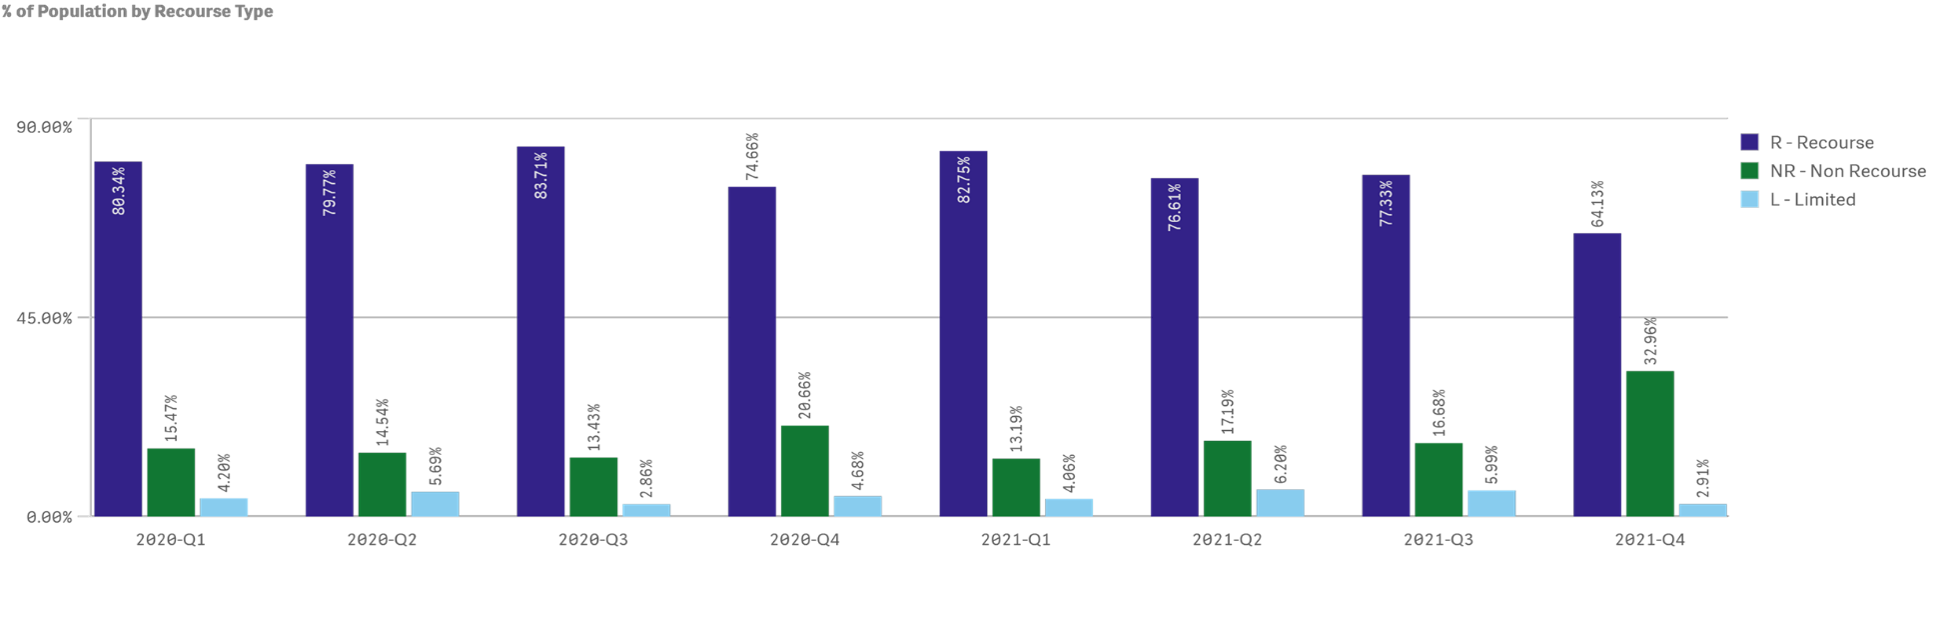
Non-Recourse
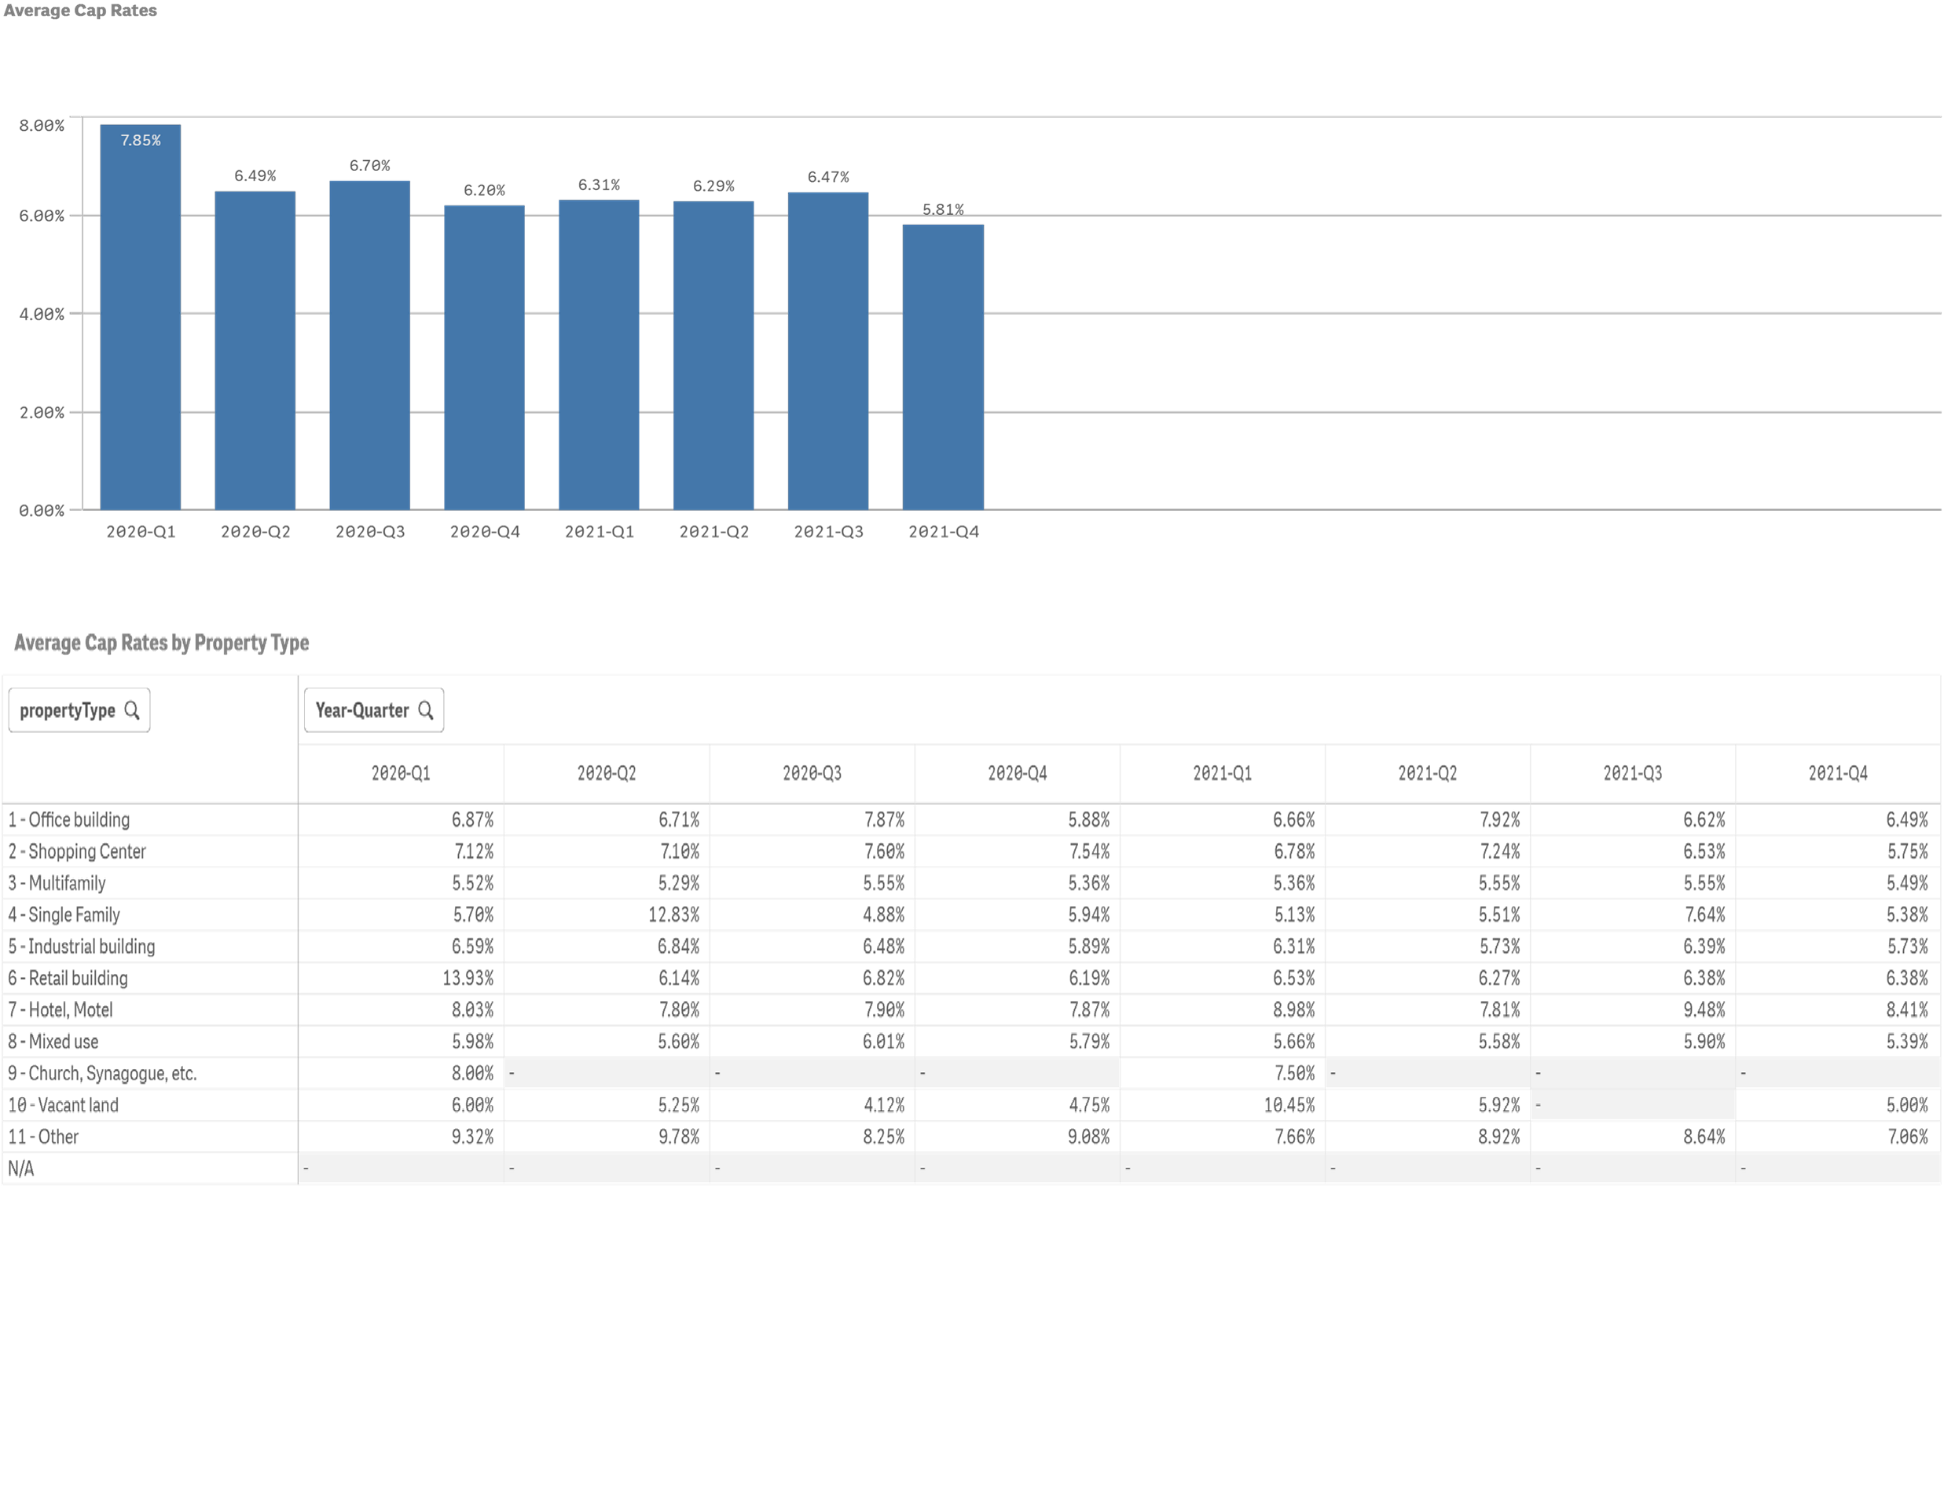
Cap Rates – CRE
More Notable Bank Examiner Concerns
- A focus on industry and group concentrations in loan portfolios. It is recommended that Banks review current concentration limits, adjust as appropriate and closely monitor, especially those sectors under pressure from the COVID impact, ex. office & retail. Commercial real estate remains an area of particular concern as it is a significant credit concentration for most midsize and community banks.
- Emphasis placed around timely and ongoing loan reviews with expectations that Banks increase the frequency of individual loan reviews based on severity of risk. Quarterly or monthly reviews for higher risk transactions may be appropriate.
- An increased emphasis for a more detailed Stress Testing (“ST”) of a Bank’s construction loan portfolio segments.
- Tracking of adherence to credit policy and properly documenting the mitigating factors in detail. Banks are recommended to take a periodic look at their policies including determination of appropriate underwriting risk parameters and metrics.
- Risk Ratings – It is important to evidence in the credit file the key risks of each individual borrower, considering financial performance pre-COVID-19, the impact of COVID-19 both short term and long term, relief/stimulus provided during the pandemic, repayment ability, collateral, and industry considerations. Banks should be in close contact with their largest borrowers and those with higher risk loans.
- Deferrals – Regulators will continue to look at all aspects of risk and relevant information on borrowers including the willingness and ability of guarantors and/or sponsors to support the underlying borrowers, with focus on sufficient liquidity or alternative cash flow to cover shortfalls.
CEIS Review is the market leading Commercial Loan Portfolio consulting firm established in 1989 by Bankers.
Loan Review, Portfolio Stress Testing, Reserve Methodology Validations, Portfolio Acquisition Review (Due Diligence) , Leveraged Lending Review, Loan Policy & Process Review, Customized Loan and Credit Seminars, and other customized engagements.
(888) 967-7380
[email protected] www.ceisreview.com [email protected]