Click to Download Full PDF Here
On a quarterly basis CEIS Review compiles averages on commercial loan portfolio quality indicators based on loan reviews completed by CEIS Review by QE.
More Notable Bank Examiner Concerns
- Borrowers are exposed to the continuing effect of the COVID, trade tensions, and increases in interest rates. CEIS recommends reviewing current concentration limits, adjust as appropriate and closely monitor especially those sectors under pressure from current conditions. Amongst the broadly defined community banks, commercial real estate remains an area of concern as it remains a significant risk concentration.
- Naturally, timely and ongoing loan reviews are an important part of monitoring portfolio quality. Lenders should consider if increases in the frequency of individual loan reviews based on severity of risk might be warranted. Those exposures in the lower risk grade levels or in stressed industry sectors or in product concentrations might be candidates for increased frequency of review.
- Lenders have shown an increased willingness to waive credit policy guidelines. Tracking credit policy and documenting the mitigating factors are important actions in keeping such actions in perspective
- Risk Ratings – The period of “tolerance” in assigned risk ratings is largely in the past. Assigned grades are expected to reflect strengths and weaknesses as represented in reasonably current financial information and operating performance. Naturally entering record of analysis in the credit file outlining the key risks of individual borrower, both short term and long term, as well as reporting the periodic contact with borrowers is important.
- Deferrals – Regulators will continue to look at all aspects of risk and relevant information on borrowers including the willingness and ability of guarantors and/or sponsors to support the underlying borrowers, with focus on sufficient liquidity or alternative cash flow to cover shortfalls.
- Stress testing is an important measure on both a loan and portfolio basis. A program that provides transactional stress scenarios to identify potential weaknesses that roll up the transactional findings to the portfolio level is most often a beneficial aid to portfolio management.
Provisions for Credit Losses, Reserves and Net Charge-Offs
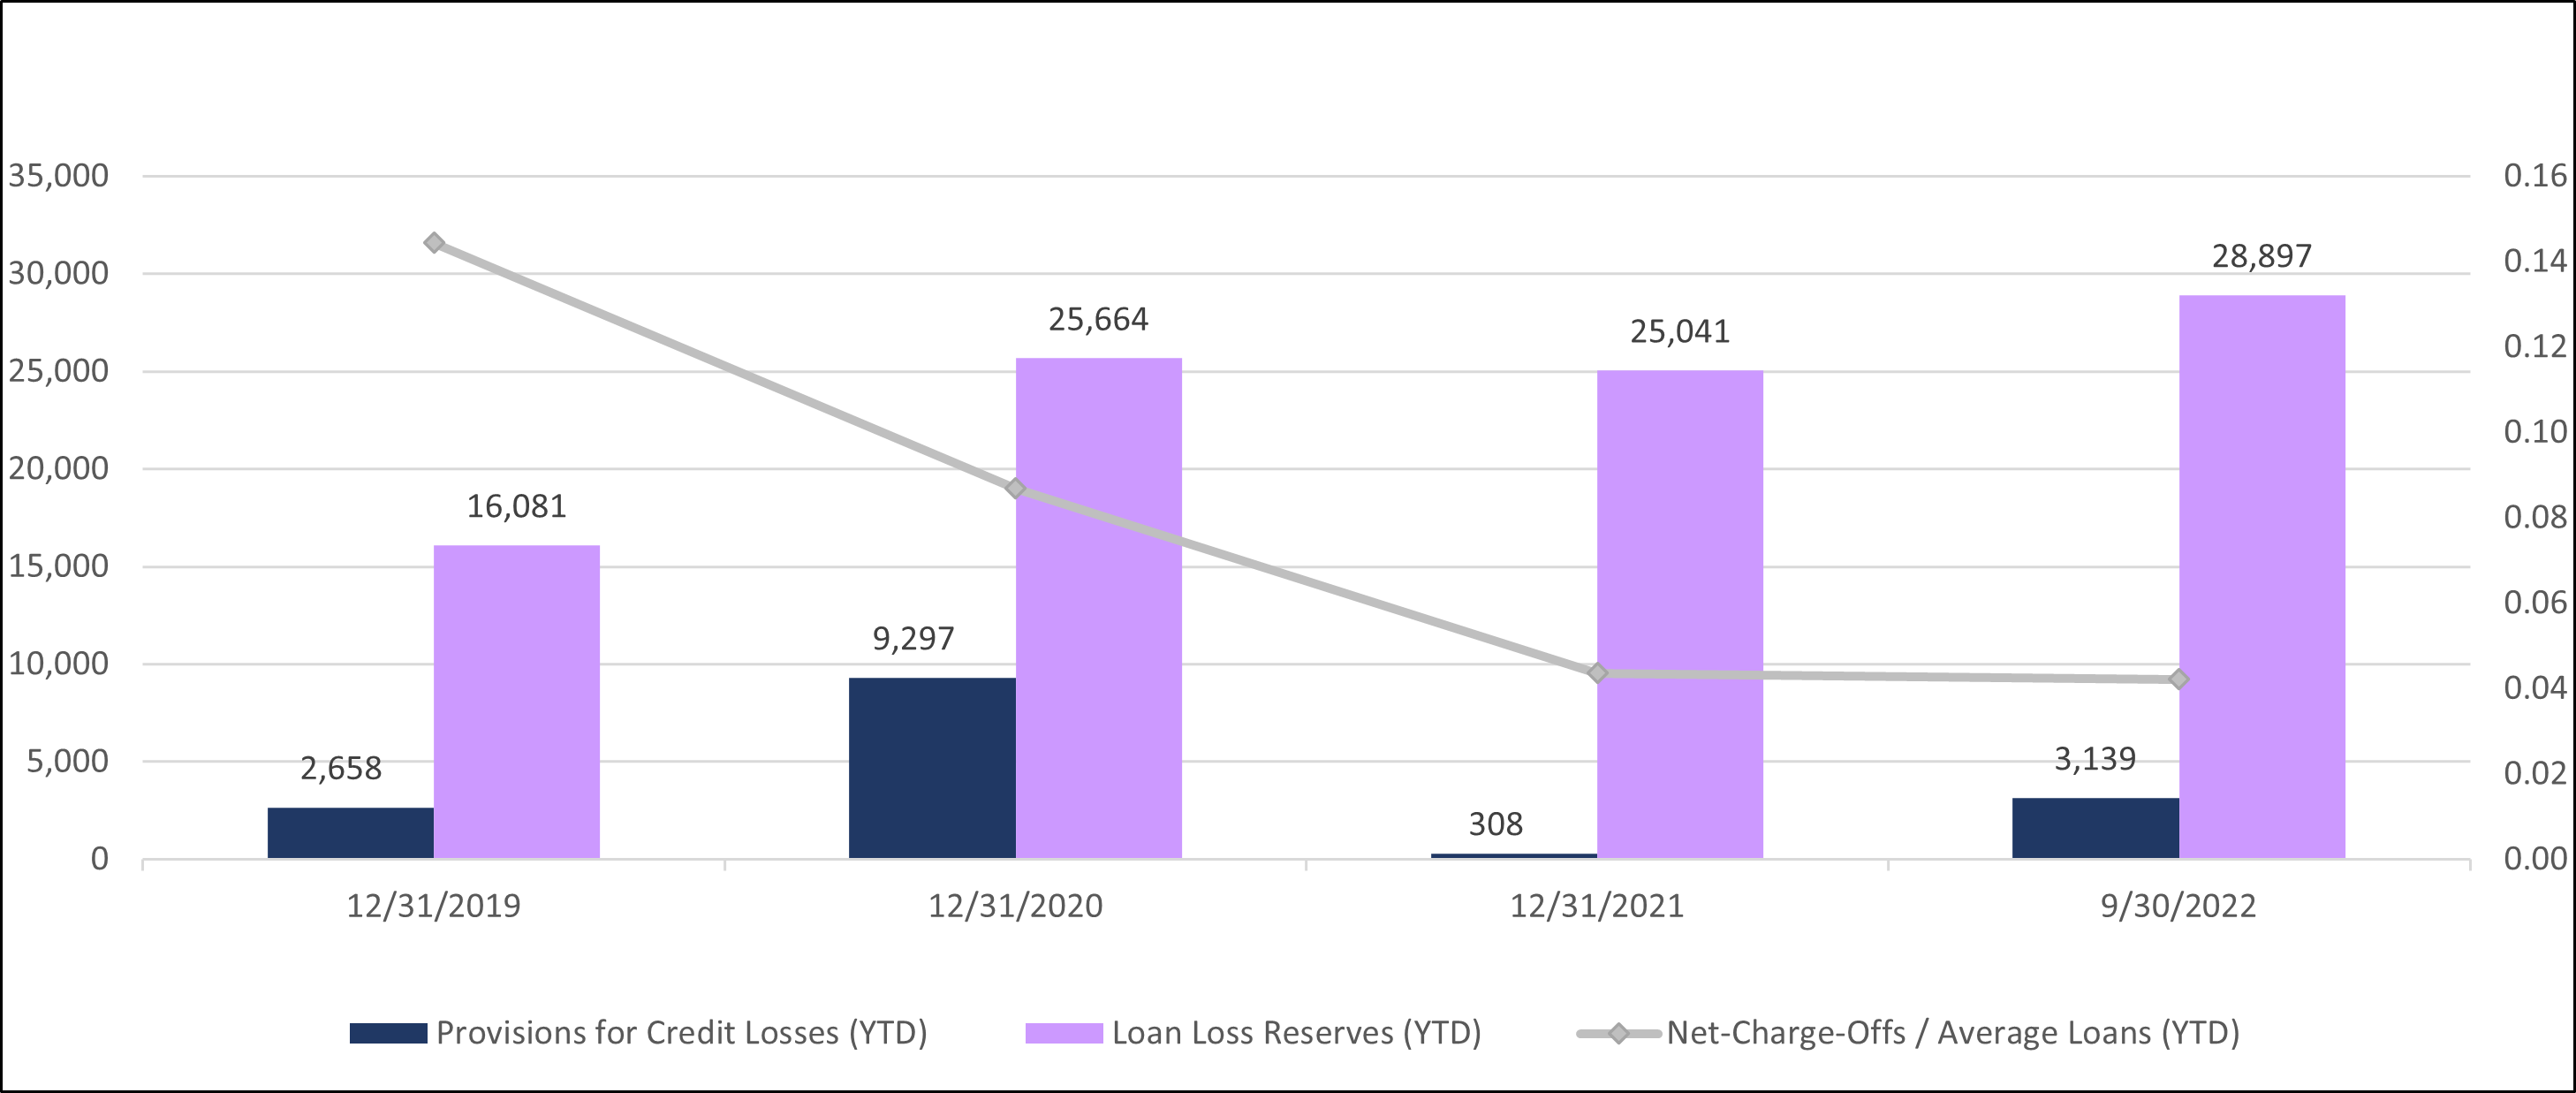
The provision for credit losses for the CEIS client base dropped from FYE20 to FYE21 but increased steadily during 2022 to a level nearing FYE20. Loan loss reserves for the group also showed an increase and net charge-offs represented an annualized 0.04% of average loans at Q3 2022, however, remains below the 0.09% reported at FYE20.
Loan Quality 1
Based on the CEIS client base, the following shows the trendline on criticized (Special Mention, Substandard, Doubtful) and classified (Substandard, Doubtful) loans relative to portfolio.
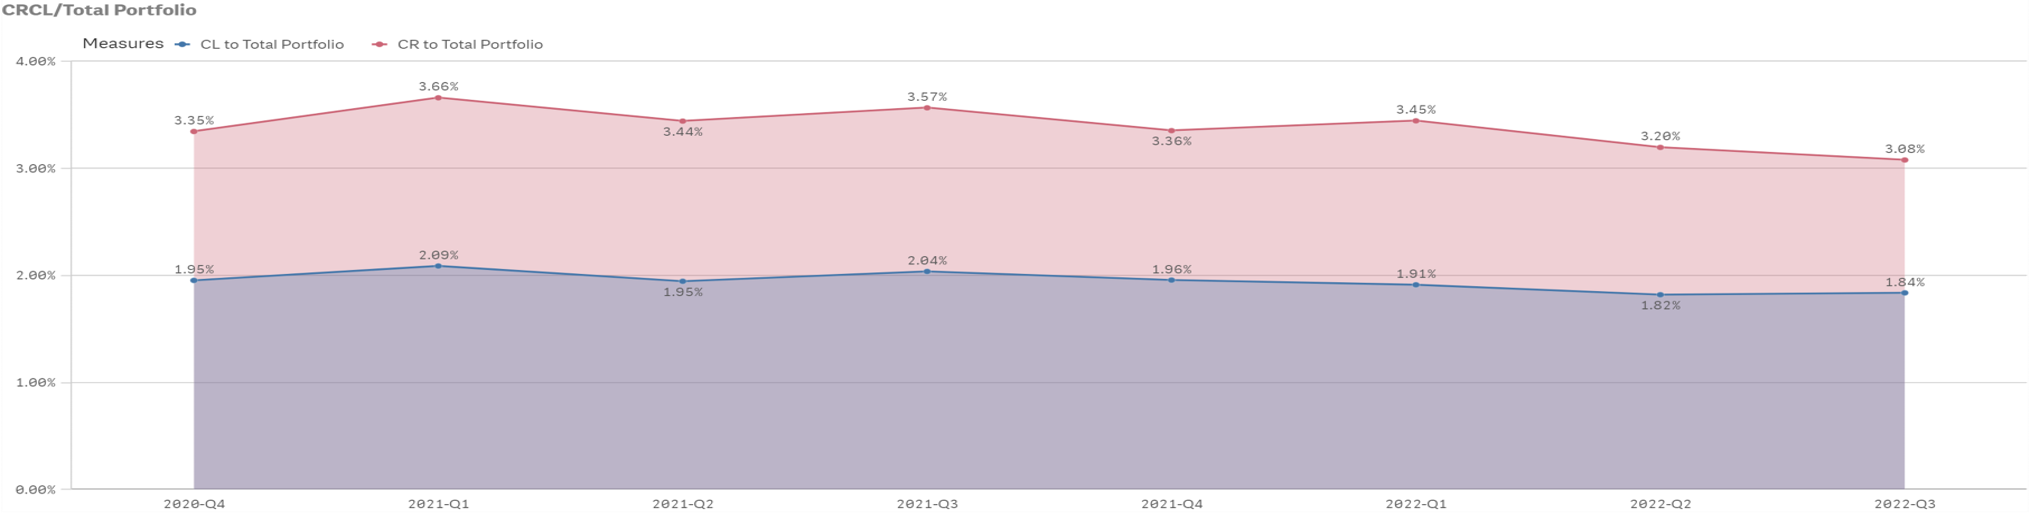
The average level of criticized loans* to portfolio continued to decline to 3.08% at Q3 2022 compared to 3.20% at Q2 2022 and 3.57% one year earlier at Q3 2021. Classified loans** relative to portfolio remained relatively flat at 1.84% at Q3 2022 compared to 1.82% at Q2 2022, however, remains below the 2.04% reported one year ago at Q3 2021.
*Defined as the sum of Special Mention, Substandard and Doubtful
**Defined as the sum of Substandard and Doubtful
Loan Quality 2
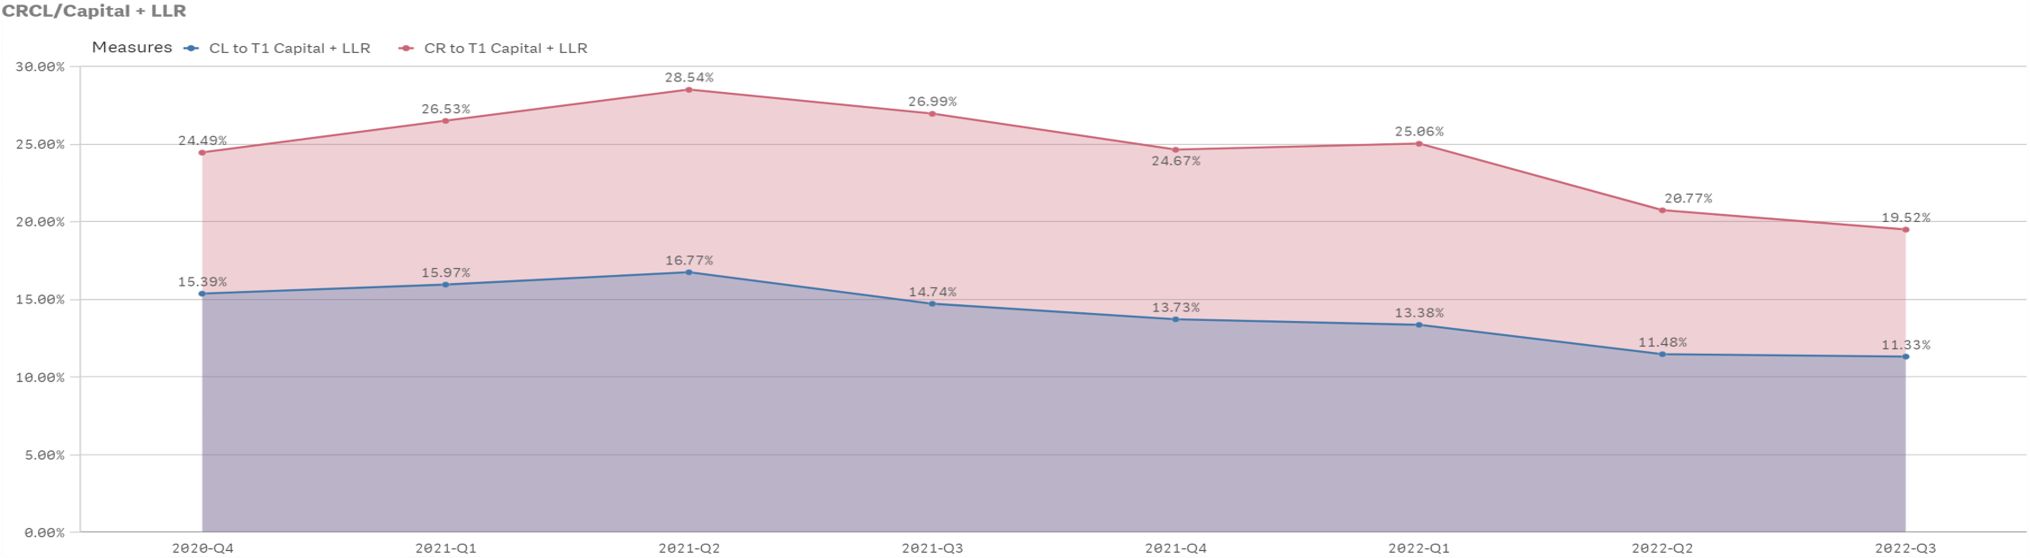
Source: CEIS Data for All Banks
The above presents the CEIS trendline on criticized (Special Mention, Substandard, Doubtful) and classified (Substandard, Doubtful) loans relative to Tier I Capital + LLR.
Criticized loans to Tier 1 capital plus loan loss reserves continued a downward trend from 28.54% at 2Q21 to 26.99% at 3Q21, and further to 19.52% at 3Q22. The more critical ratio of classified loans to Tier 1 capital plus loan loss reserves also decreased from 16.77% at Q2 2021 to 14.74% at Q3 2021 and to 11.33% at Q3 2022.
Over the last eight quarters criticized and classified loans relative to Tier 1 capital plus loan loss reserves ranged from 19.52% to 28.54% and 11.33% to 16.77%, respectively.
Grade Outlook – All Loans
The statistics on grade outlook are forward looking estimates based on the most recent borrower provided financial information as well as other related information within the credit file.
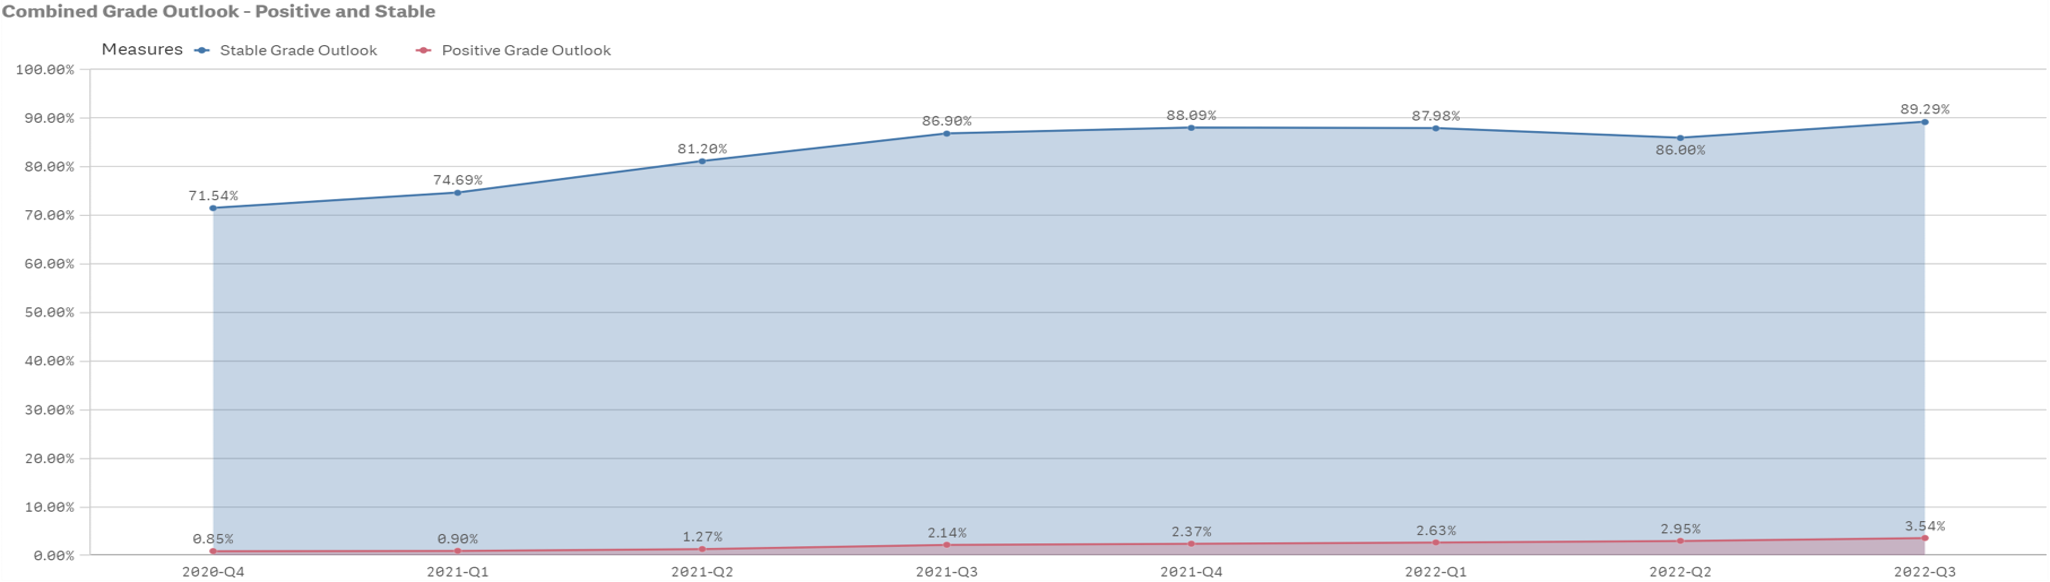
Source: CEIS Data for All Banks
CEIS’ estimates of grade outlook were trending upward from Q4 2020 through Q1 2022 in that the positive plus stable estimates improved during that time while negative estimates plus those assigned “insufficient data” to reasonably determine outlook have declined (not reflected in above graph). The decline in ISD assignments reflects the continued receipt of borrower financials.
Financial Trend – All Loans
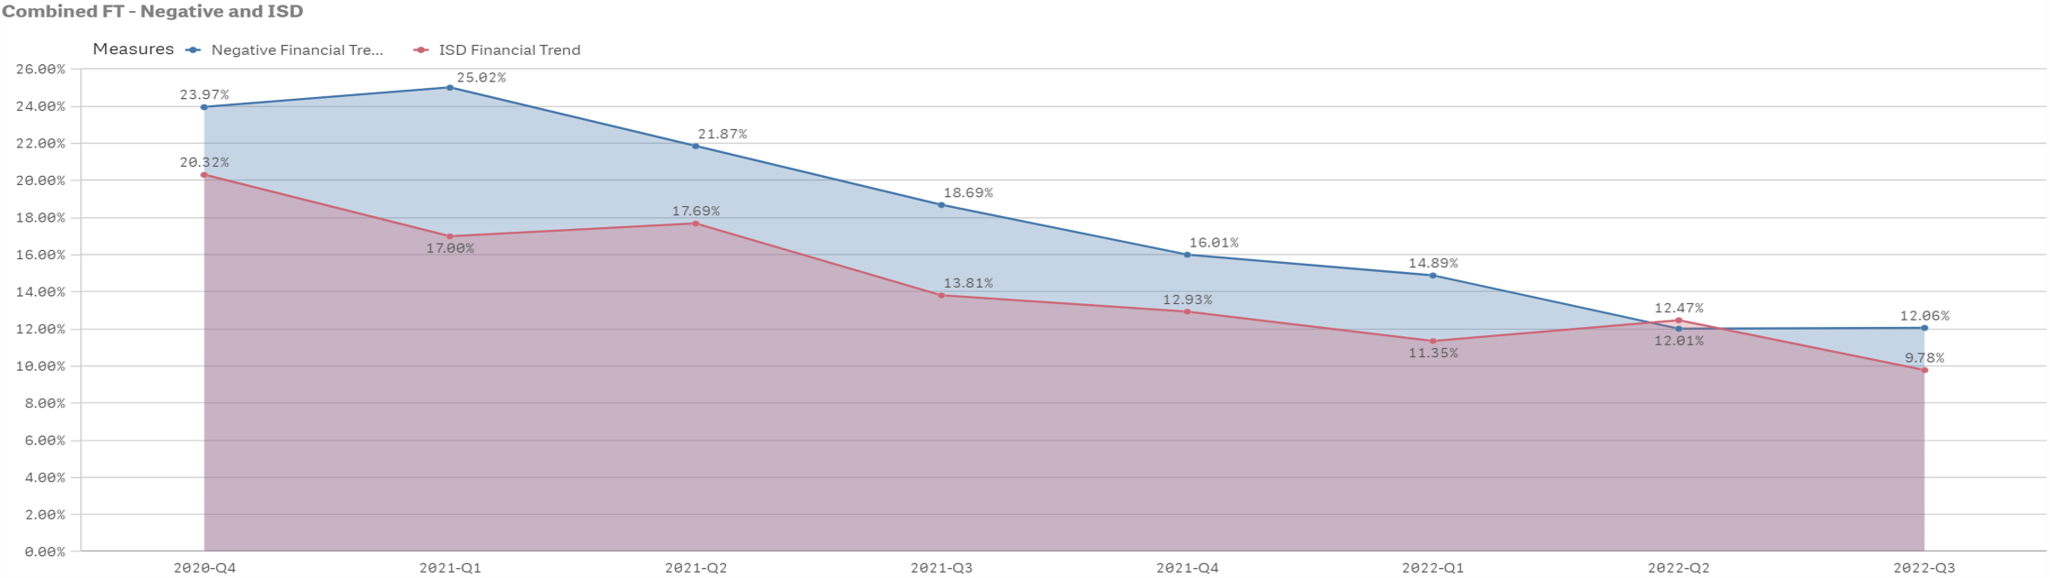
Source: CEIS Data for All Banks
The statistics on financial trends are backward looking determinations based on the most recent financial data provided by the borrowers.
The level of loans assigned a negative financial trend was 12.06% at Q3 2022 compared to 12.01% at Q2 2022 and is below the 18.69% reported one year earlier at Q3 2021.
On average, an ISD financial trend was assigned for 9.78% at Q3 2022 of the loan amounts reviewed, down from 12.47% at Q2 2022 and the 13.81% reported at Q3 2021.
Technical Exceptions – by Type
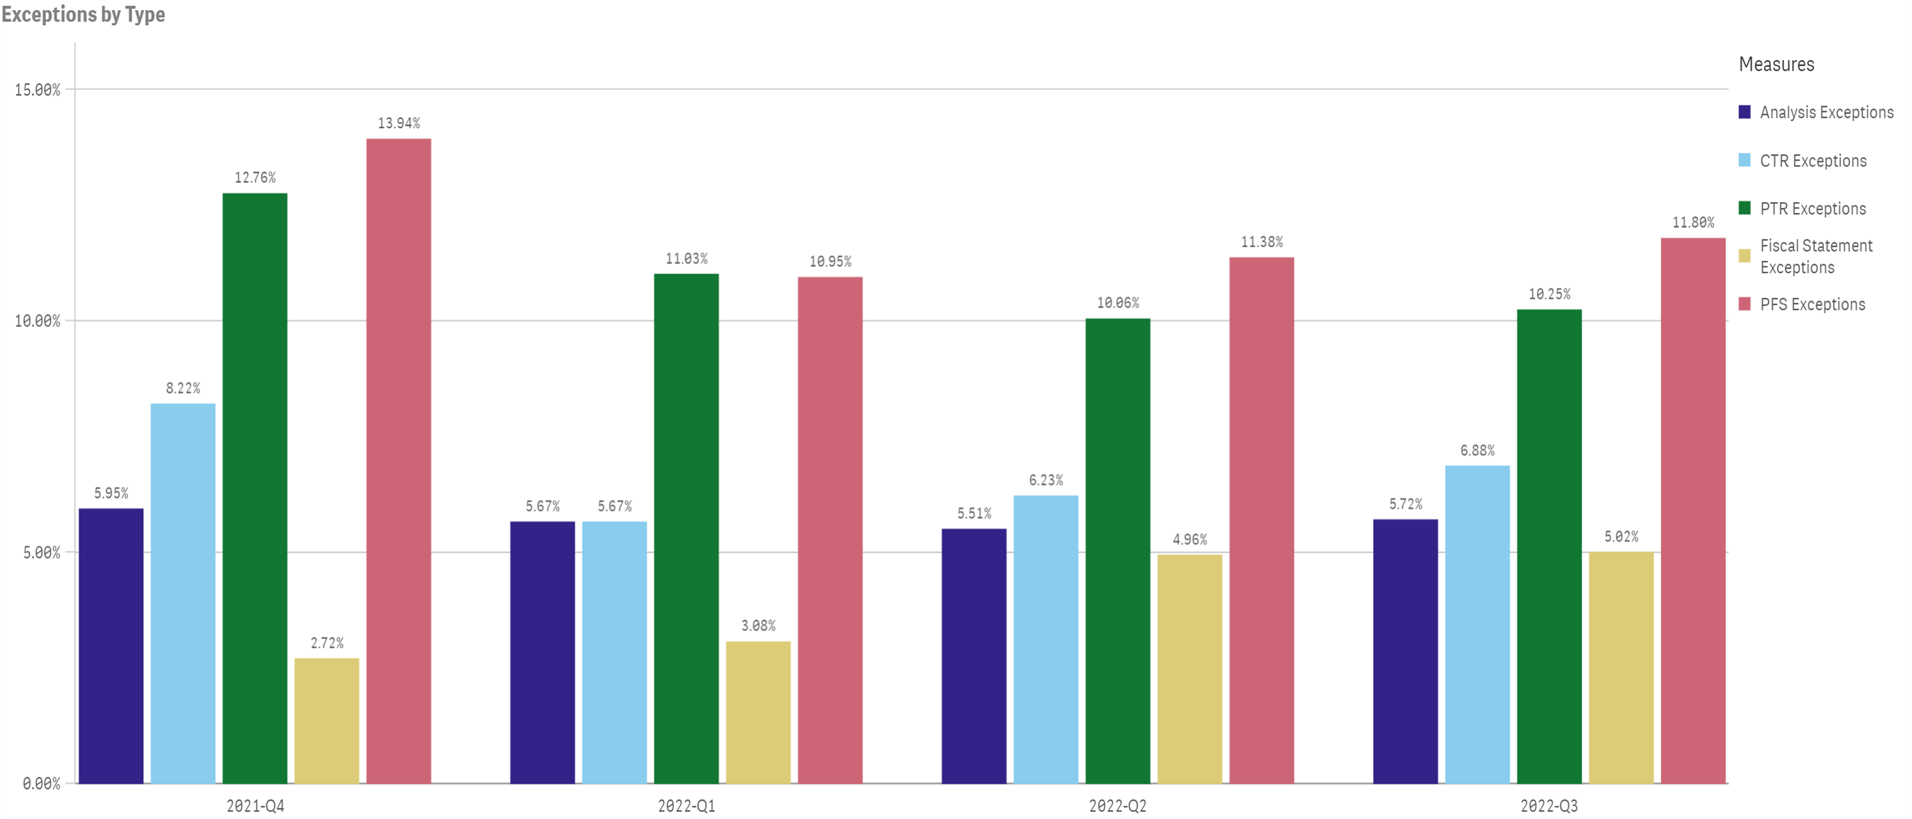
Source: CEIS Data for All Banks
Covenant Compliance
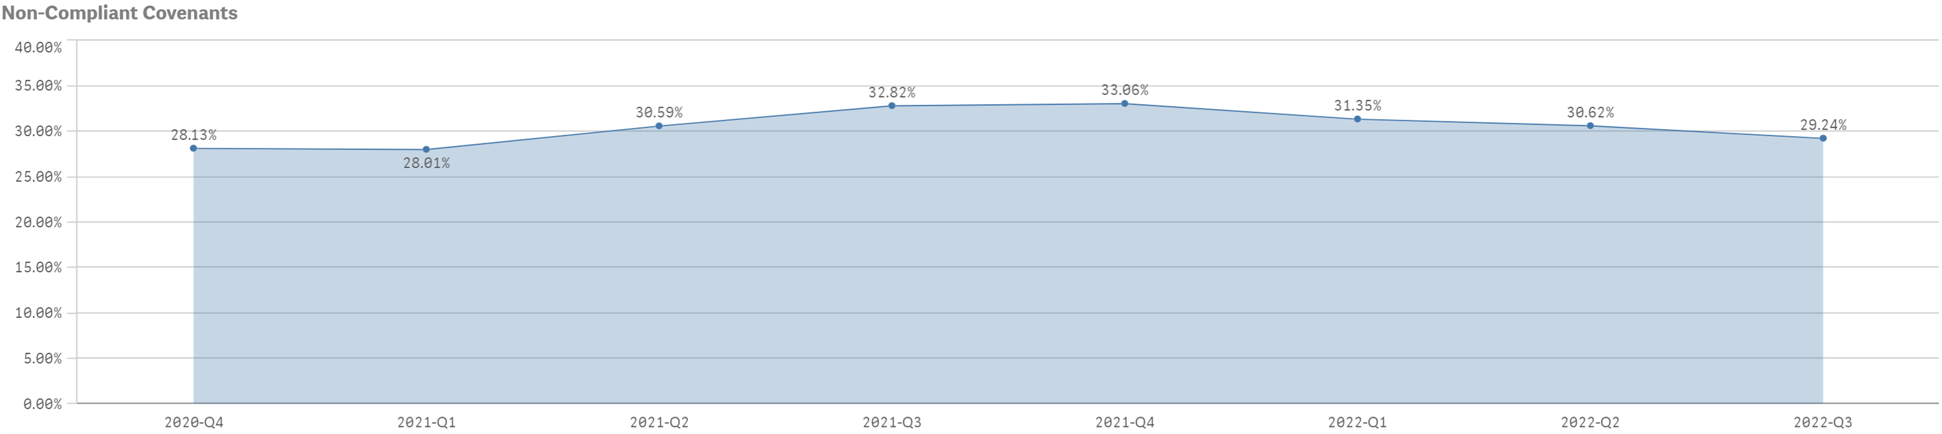
Source: CEIS Data for All Banks
The trend line regarding the average level of non-compliance has been declining slightly over the last few quarters with non-compliance averaging 33.06% at Q4 2021, 31.35% at Q1 2022, 30.62% at Q2 2022 and 29.24% at Q3 2022.
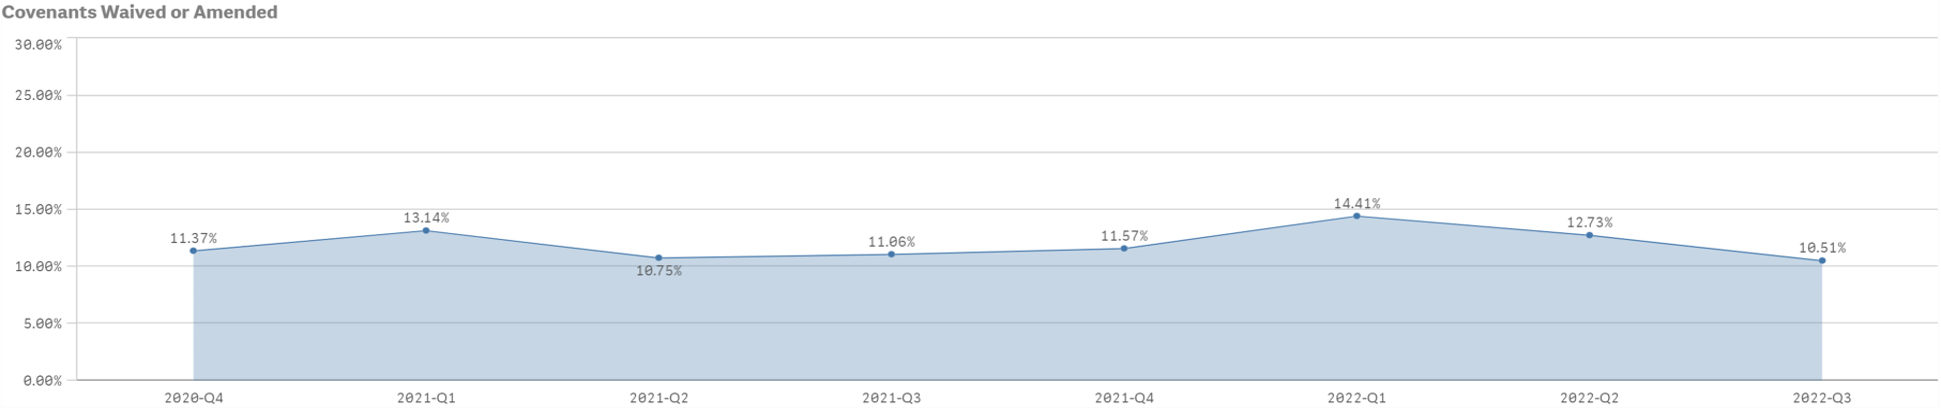
Source: CEIS Data for All Banks
The level of covenants that were waived or amended declined to 10.51% at Q3 2022 compared to 12.73% at Q2 2022.
Credit Policy Exceptions – New and Renewed
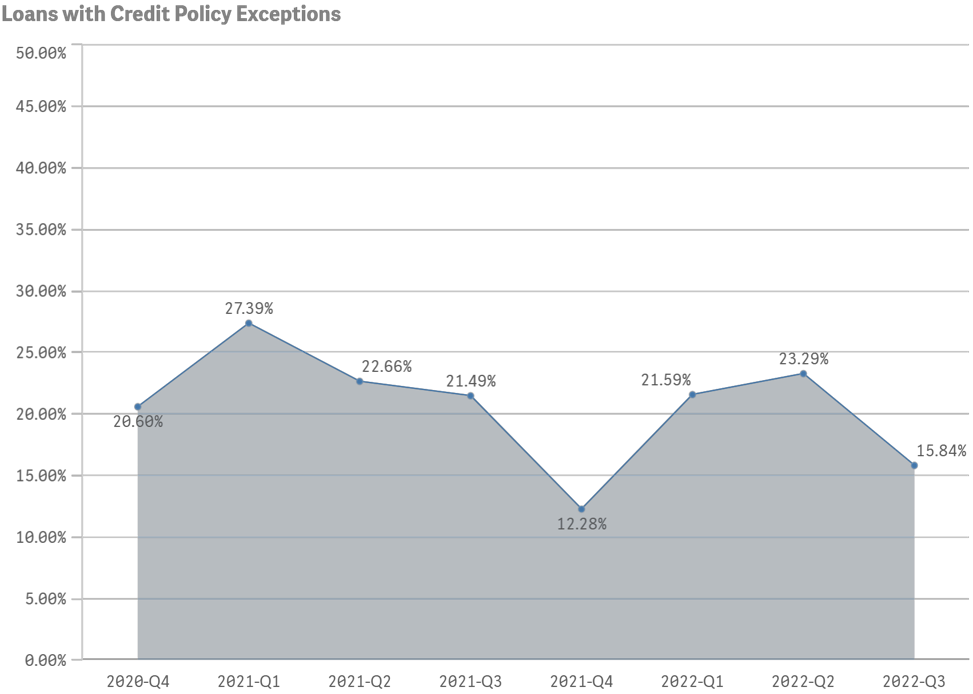
Source: CEIS Data for All Banks
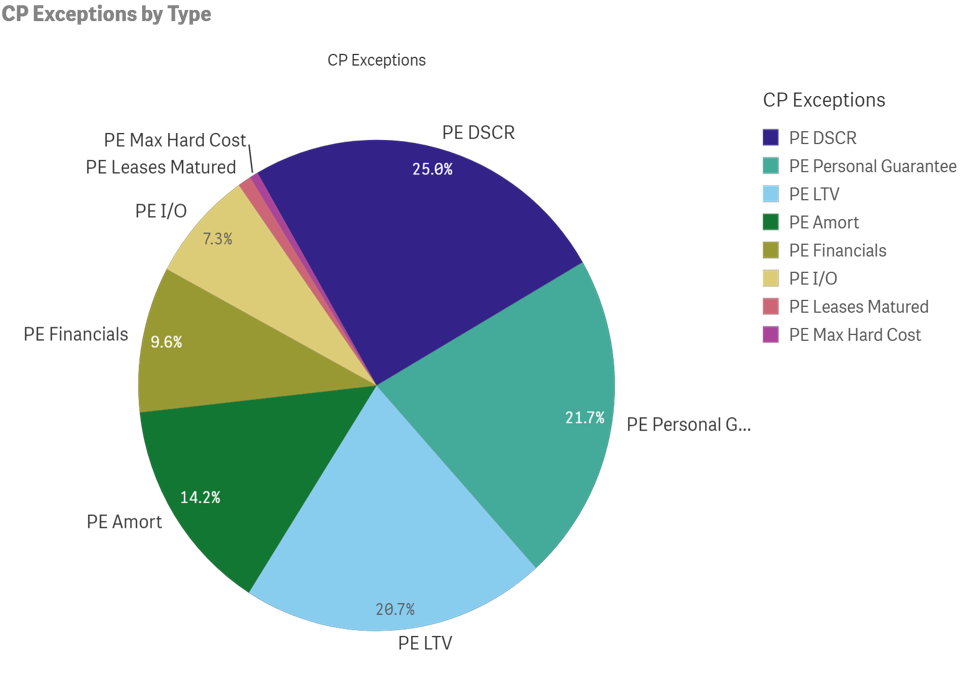
Source: CEIS Data for All Banks
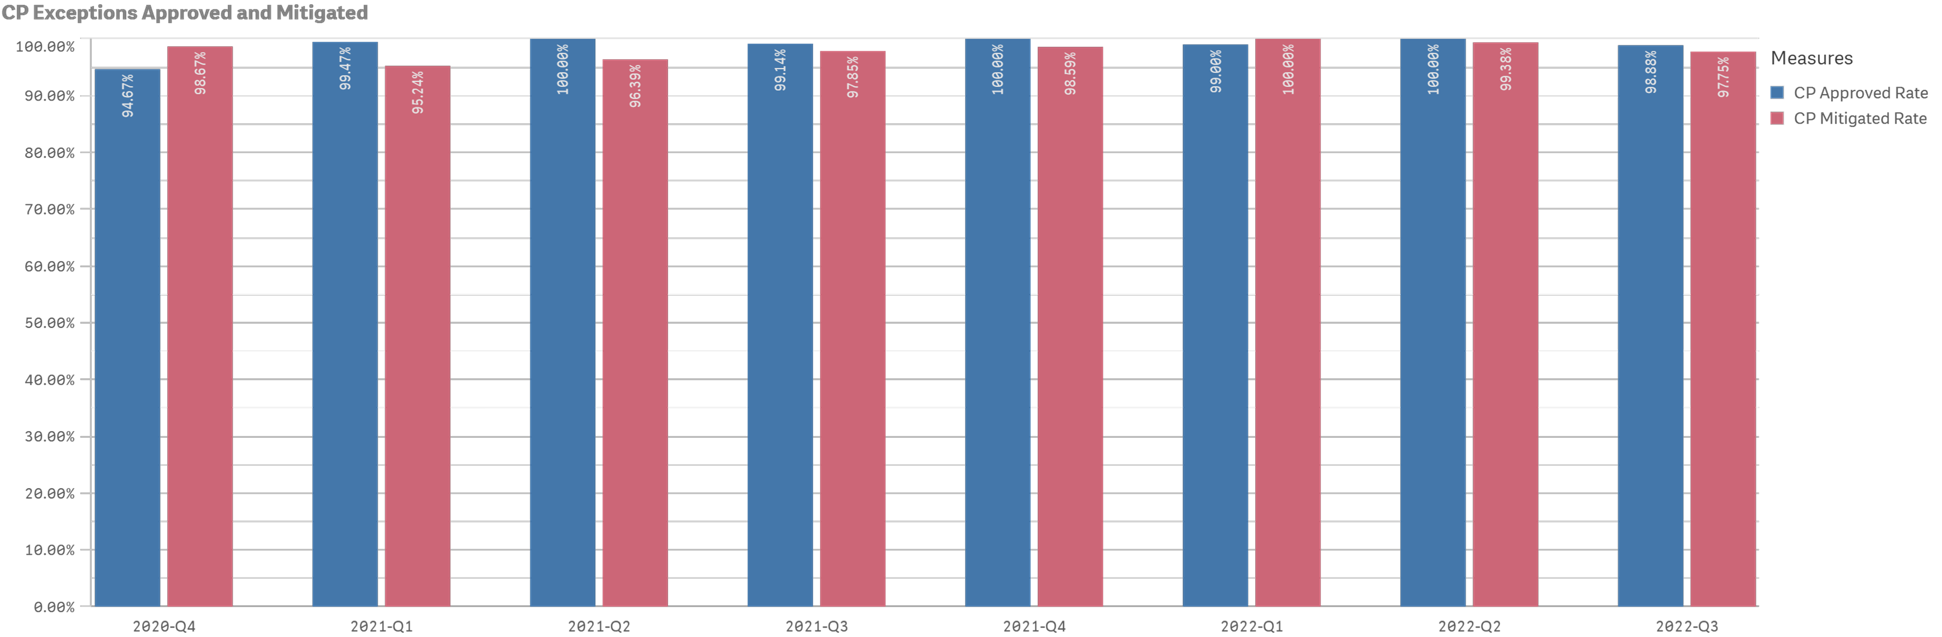
Source: CEIS Data for All Banks
Non-Recourse – New and Renewed
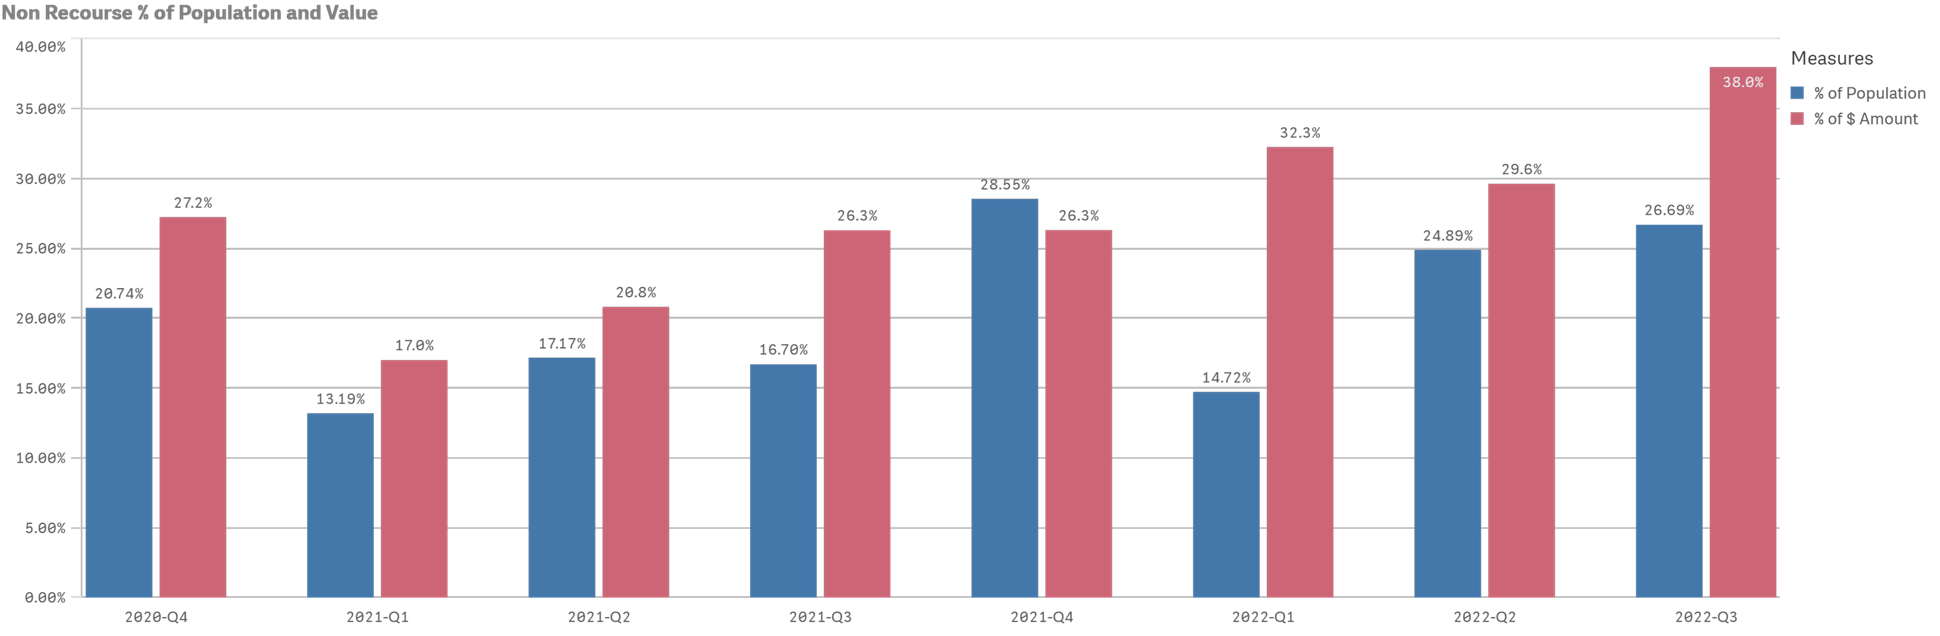
Source: CEIS Data for All Banks
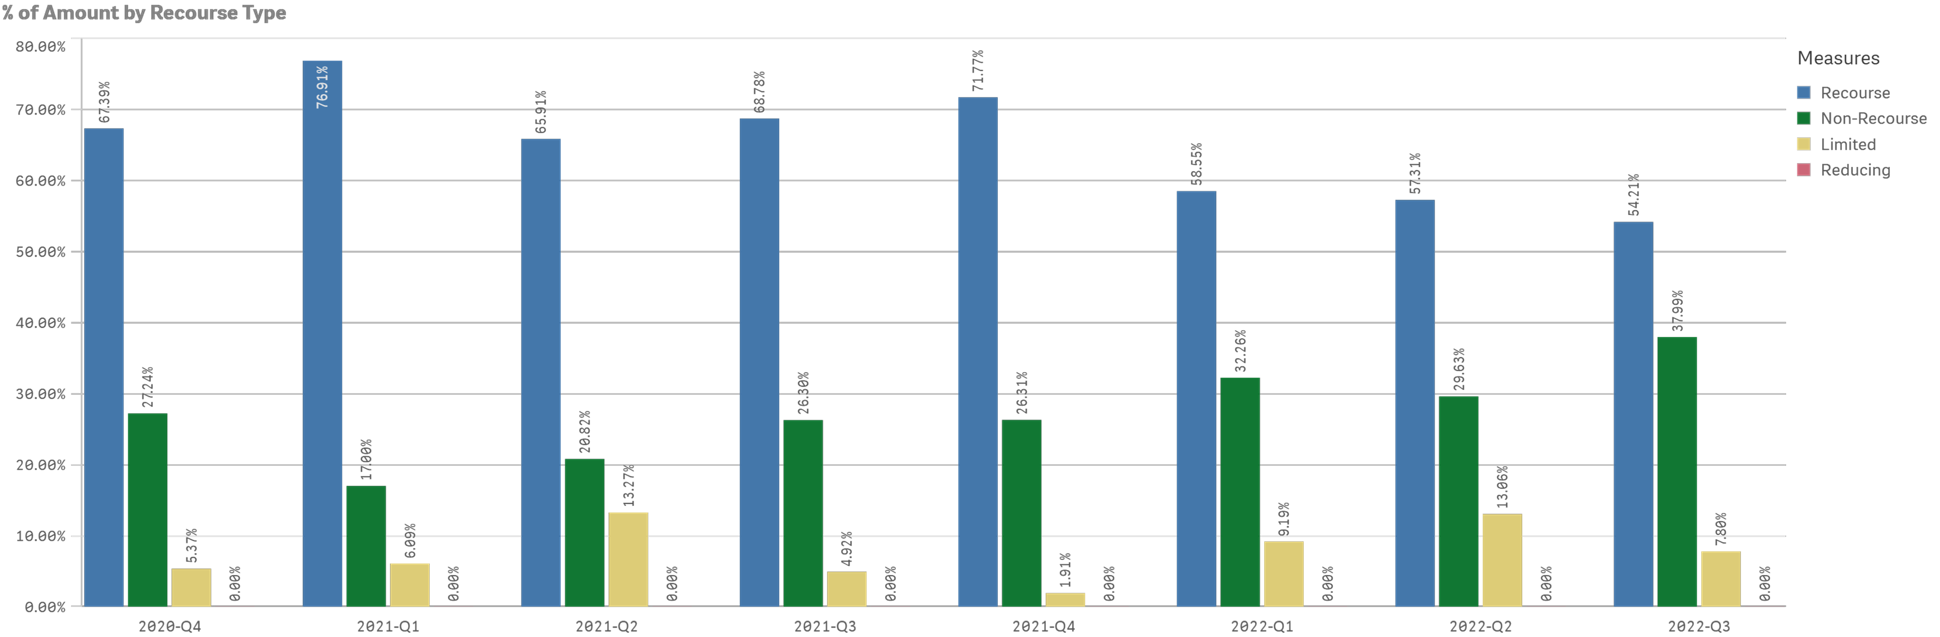
Source: CEIS Data for All Banks
CEIS is an independent consulting firm established in 1989, serving the needs of organizations with general and/or specialized commercial loan portfolios.
![]()
Loan Review, ALLL / LLR Methodology and Validation, Portfolio Stress Testing, Portfolio Acquisition Review, Leveraged Lending Review, Municipal and Public Finance Review, Loan Policy Maintenance, Process Review, and Customized Loan and Credit Seminars.
(888) 967-7380
info@ceisreview.com
www.ceisreview.com
Joseph J. Hill – jjhill@ceisreview.com
Elaine M Cottrell- ecottrell@ceisreview.com
Justin J. Hill – justinjh@ceisreview.com