
Why retaining and experienced credit professionals is necessary; and how it improve the effectiveness of ALLL/ CECL modeling through the use of Correlation – The CEIS Quarterly Newsletter – Volume 5, Issue 4
Select here: The CEIS Review Quarterly – Volume 5, Issue 4
New York, November 15, 2019 – CEIS Review Inc. is a Commercial Loan Portfolio Consulting firm serving the needs of Commercial Lending Institutions. In this issue of our newsletter, we discuss why retaining qualified and experienced credit professionals is necessary; and how it improve the effectiveness of ALLL/ CECL modeling through the use of correlation.
Retaining Qualified & Experienced Credit Professionals
 Having qualified personnel review and execute your annual credit risk review plan is something that should not be overlooked. Having the best and well thought out plan is powerless unless administered correctly and given its own authority.
when hiring a credit risk profession- also, you should always consider their education level, experience, and the extent of formal credit training. Additionally, their knowledge of the relevant laws, regulations, and regulatory guidance are all equally as important in selecting a credit risk professional or firm.
Beyond the skill sets that a candidate or firm brings with them, upon hiring they should become intimately knowledgeable of the institution’s lending guidelines for each product the Institution offers. You want your all three lines of defense working cohesively towards the same goals – keeping credit risk within the established thresholds set forth by the Board.
Having a professional resource that can identify the emergence of potentially problematic loans, industry segments, or underwriting practices, is an invaluable resource during calm and turbulent times.
At CEIS Review, we take hiring credit professionals very seriously and we hold all of our credit trained professionals to defined expectations, to the benefit of our clients.
Improving the Effectiveness of ALLL/CECL Modeling through the use of Correlation
A study from the financial crisis by the Congressional Research Services indicated that in the seven years prior to the crisis (2000 to 2006) loan values increased by 85% whereas the credit loss reserves increased by only 21%. Directional consistency was not readily apparent in the data that was analyzed. It was information like this that led to the changes to reserving we are all now facing.
First as Bankers and now as consultants, we have seen the tremendous amount of work and time that is put into preparing the reserve amount. From the building of models to their operation and validation, we have personally experienced what everyone goes through to conduct the analysis and the concern and consternation that occurs when the auditor’s, regulators, loan review and validators take the results and put the model through its paces, testing the analysis, results, and controls around this important calculation.
One of the things we have repeatedly found is that, while most financial institutions do a good job of running the model and preparing the quarterly reserve, there is not as much attention paid to trending analysis, which can result in a fluctuating amount even during a consistent economic environment. This article presents correlation analysis as a way to study the effectiveness of the model and ensure the results reflect the current state of the bank and the economy. We will also examine how to use this for the upcoming paradigm shift in how the allowance is deter- mined.
The financial regulators are in the process of finalizing their rules for the “interagency Statement of Allowances for Credit Losses (ACL’s). On October 17, 2019, the agencies issued a request for comment and published it in the Federal Register, Vol. 84, No. 201. the comment period closes December 16, 2019. The Allowance for Loan and Lease Losses (the incurred loss approach, which will be referred to as the ALLL) is receiving significant attention right now (and for the foreseeable future) because of the introduction of the Current Expected Credit Losses (CECL) by the Financial Accounting Standards Board (FASB) and the financial institution regulators.
The concept was introduced in 2008 by the then newly formed Financial Crisis Advisory Group (FCAG), which had been established by FASB and their international counterpart (IASB) to identify improvements in financial reporting coming out of the financial crisis.
The goal was to explore more forward-looking alternatives to the incurred loss methodology.
In 2016 the CECL accounting standard was adopted by FASB and shortly thereafter by the financial institution regulators, making it the new standard to be used for reserving for credit (and other earning asset) losses. CECL is going into effect in 2020, with a staggered roll out over the next few years.
Adopting CECL has forced financial institutions to revisit their approach to reserving for loss and has, in many cases, caused a bit of an upheaval in the organization. For some, the ALLL has been a determination that has not seemed very applicable to the Bank’s actual loss experience. For others, it is a number that is not well understood and as long as the auditors and regulators like it (or don’t reject it) everything is okay. For a few, the linkage between loss and reserves is logical and well understood. All of this is being challenged with the introduction of CECL, which is forcing financial institutions to essentially start all over again and build a new model for the reserve.
Starting over again begins with the recognition that the ALLL and CECL are accounting and capital measurement standards and is not really meant to be used to proactively manage the credit portfolio. As an accounting standard, the ALLL and CECL both represent point-in-time values that are calculated as a result of actions taken in the past. Both are intended to be a multiple of the actual net loss experience of the bank. But in order to calculate an effective ALLL/CECL number, credit and accounting need to work together to define the credit characteristics of the loans (assets) and then turn these characteristics into a specific value that is applied to financial statements and regulatory reporting.
Both the ALLL and CECL are considered to be critical financial models deployed to determine an appropriate reserve amount. The Securities and Exchange Commission (SEC) considers it to be a Critical Accounting Policy and it receives separate (and often first) coverage in the filing of the Bank’s SEC financial statements. Appropriate means, for ALLL, the current and estimated losses to be incurred by the financial institution within a short period of time (less than a year) and for CECL the expected losses over the life of the earning asset. To use modeling language, the financial institution is calculating a dependent variable (the amount to be reserved) by using independent variables (historical experience, economic information, and/or other values) for the dependent value determination.
Correlations, a brief discussion
Correlations can be thought of from an informal and formal viewpoint. Informally we often imply a correlation based on an experience we have had. People say things like, “a hot and dry summer (independent variable) leads to a cold and snowy winter (dependent variable)”, without any basis other than our own experiences or what others have told us. They are indicating that because we are experiencing one, the other is highly likely to follow.
And while these events may be correlated, they may not have a causal relationship (when one thing is known with high certainty to cause or affect another thing) and we certainly have not gone through the rigors to prove their dependence.
The formal concept of correlation is a statistical measure that indicates the extent to which two or more variables fluctuate together. A positive correlation indicates the extent to which those variables increase or decrease together; a negative correlation indicates the extent to which one variable increases as the other decreases. No discernable correlation indicates that we can’t tell if the data correlates or not. Mathematically this translates into a value of plus 1.0 for positive (and perfect) correlation, minus 1.0 for negative (and perfect) correlation and anything around zero indicates we cannot tell if the values correlate or not.
Back to the ALLL/CECL
We have been validating and otherwise working with ALLL models (including with financial institutions under a regulatory directive or order) for several years and are now validating the CECL models prior to their implementation. The models developed or purchased by financial institutions and used for determining the value of ALLL or CECL do not change very often. Which is actually a good thing because repeatedly changing a model creates its own sort of issues. In the write-ups supporting the results, we see a comparison to prior results and even comparisons to peers. These comparisons are presented as absolute values (Bank A has a reserve of 1.20% which compares favorably to peers at 1.24%, as an example). The focus is on the reserve for that particular quarter. As an accounting concept, that would seem to be appropriate, except when issues occur (which we refer to as a “bad day”) and the bank has to explain why directional consistency was not maintained or why an event was unexpected when it should have been expected and reserved for.
When we validate a model, we look for a correlation between the reserve amount (ALLL) and a set of variables that can be considered to be causal. We also test a few variables that can be considered to have a non-causal relationship, such as Total Unused Commitments. The non-causal data assists with the discussion of the causal data. The data is taken from the Call Report for a period of time (from the most recent quarter and going back) where the Bank maintained model consistency. For this study, correlation provides important information on trending and directional consistency, which as will be discussed later, is an important concept in determining the strength of the modeling process. Below is an example of a correlation comparison for a sample financial institution using 28 quarters of consecutive data. The analysis is based on the ALLL leading the independent variable by one quarter, is concurrent, or lags by one quarter.
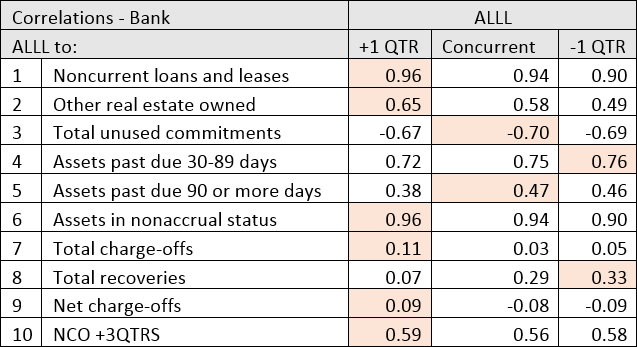
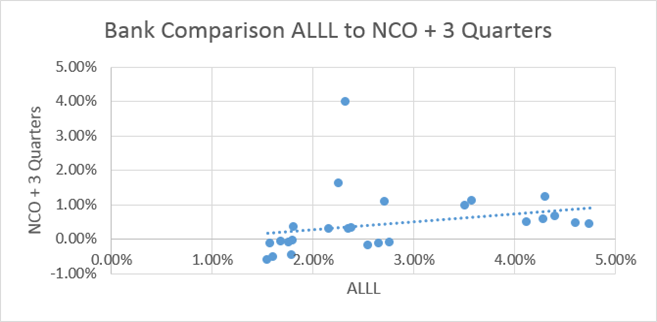
As can be seen, the Bank has a very strong correlation to Noncurrent loans and leases (1) whereas there is no discernible correlation to Net Charge-Offs (NCO) (9). However, the NCO correlation improves to a moderate state when the next three quarters are added into the current quarter. Below is a scatter diagram comparing the ALLL to the NCO + 3 Quarters (10). As can be seen in this visual depiction, there is a period where the NCO increased significantly but the ALLL did not.
Because so much of the ALLL is driven by the Qualitative Factors (QF) right now, we find that the subjective variables can cause the ALLL to lose directional consistency with respect to the loss trend. This can have significant repercussions, especially when that bad day arrives. To see how, we will look at Colonial Bank, a $25 billion financial institution that failed in 2009. Colonial Bank is chosen because it has a great set of public documents that specifically point to a lack of trending analysis in determining the ALLL.
Colonial Bank
Colonial Bank’s failure was partially driven by a significant fraud that was uncovered as a result of the housing crisis. PWC and Crowe were both sued by the FDIC and settled for $335 million (in 2019) and $60 million (in 2018), respectively, for their inability to uncover the fraud through their audits. In 2011 the SEC sued the Bank holding company for violation of Federal Securities Law. In the SEC lawsuit, there were over 135 references to the weaknesses in the ALLL and the ALLL determination process. The specific language used was that “Defendants knew or were reckless in not knowing that Colonial employed an inadequate loan loss reserve methodology…”. Towards the end of the 334-page lawsuit (Colonial Bancgroup, Inc. Securities Litigation, April 29, 2011), the following information is represented in the following graph;
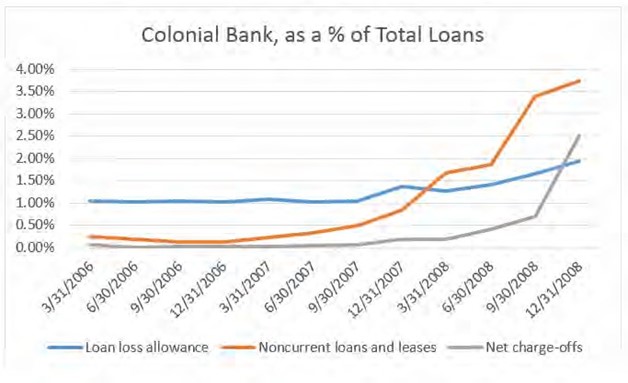
As further stated in the lawsuit, “Further, analytical procedures would have also alerted PwC (the auditor), by first quarter 2008, of the trend that Colonial’s NPA had exceeded the ALLL, which indicated that the ALLL had failed to consider the credit risk associated with NPAs and resulted in inadequate reserves”. A visual check like this shows that the ALLL was not directionally consistent with the mounting losses and this is supported by correlation analysis using selected timeframes within the worsening periods.
Summary
A model like the ALLL is supposed to show directional consistency in the results, which should lead to the bank being properly reserved through changes to the loan portfolio and in the economic environment. However, the point-in-time result from the ALLL model is the required result, based on accounting and regulatory standards. The ALLL has a significant impact on net income and is correctly seen as one of the most impactful calculations a financial institution prepares. Correlations are an effective way to use the point-in-time data to review the trends associated with the allowance and to ensure the reserving process is valid, reflecting the losses that are and may be incurred in the near future (ALLL) or over the life of the loan (CECL).
Every financial institution will, at some time, experience a “bad day” and be required to defend its reserving process and results. As can be seen from the Colonial Bank example, the analysis of the trend and the relationship between the independent and dependent variables is important and can be effectively assessed using correlation analysis.
-John Hurlock
References
1. Economics, Raj Gnanarajah Analyst in Financial. Banking: Current Expected Credit Loss (CECL). s.l. : Congressional Research Service, 2018. R45339.
2. States, District Court of the United. Order On the Liability Phase of the PWC Bench Trial. 2:11-cv-00746-BJR-TFM, 2:11-cv-746-BJR, 2:12-cv-957- BJR,. Alabama : The Middle District of Alabama Nort Division, 2017.
3. States, The District Court of the United. Colonial Bancgroup, Inc. Secu- rities Litigation . 2:09-cv-00104-RDP -WC . The Middle District of Alabama Northern Division : The Middle District of Alabama Northern Division , 2011.
4. Board, Financial Accounting Standards. Financial Instruments- Credit Losses (Topic 326). Norwalk, CT : Financial Accounting Standards Board, 2019. ASU2019-05.