To View in PDF: Loan Portfolio Trends Presentation – All Banks
More Notable Bank Examiner Concerns
- With the economic impact of the COVID-19 Global Pandemic still being diluted by numerous economic relief efforts throughout 2020 and into 2021, Community Banks should act conservatively within 2021. Ensuring that your Institution has the proper risk management processes in place along with a comprehensive understanding of the risks within your portfolio is critical.
- There is a greater focus on borrower group and industry concentrations within loan It is recommended that Banks review their current concentration limits, adjust limits as appropriate, and closely monitor higher risk industries such as real estate, retail, hospitality & leisure and travel.
- An increased emphasis on having timely & regularly occurring loan reviews, with the expectation that Banks will increase review frequency based on the severity of risk identified within their respective portfolios. Quarterly or monthly reviews for higher risk transactions may be appropriate.
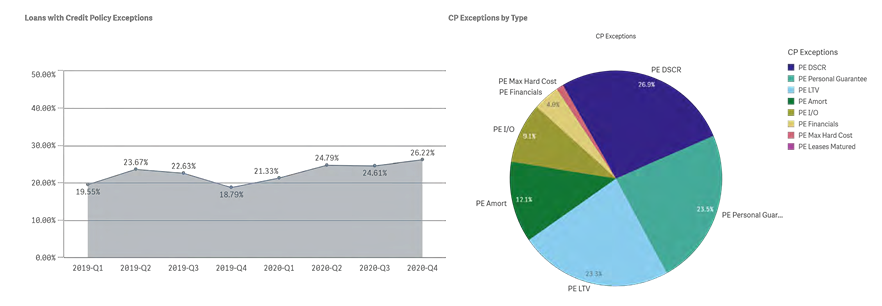
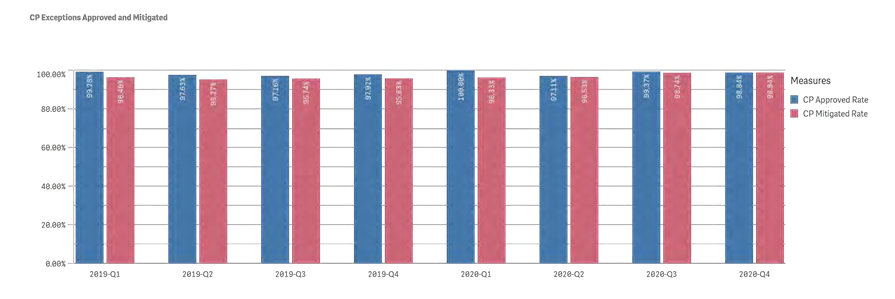
- Closer tracking of adherence to credit policy. Banks are cautioned to keep policy exceptions to a minimum and properly document all mitigating factors in detail. Banks are recommended to take a thorough look at their policies including determination of appropriate underwriting risk parameters and metrics, and adjust as needed.
- Risk Ratings – It is important to understand the key risks of each individual borrower, considering financial performance pre-COVID-19, the impact of COVID-19 both short term and long term, relief/stimulus provided during the pandemic, repayment ability, collateral, and industry considerations. Banks should be in close contact with their largest borrowers and those with higher risk loans.
- Banks need to exercise good judgment with borrowers going forward as they come off the loan deferrals or may need additional time prior to resuming normal operations. Regulators will continue to look at all aspects of risk and relevant information on borrowers including the willingness and ability of sponsors to support the underlying borrowers, with focus on sufficient liquidity or alternative cash flow to cover shortfalls.
- Stress Testing is suggested on both a loan and portfolio basis. Additionally, Banks are recommended to perform a pandemic stress test analysis that segregates the loan portfolio by NAICS code so Banks can see which industries are potential problem segments.
- Expected increase in M&A activity in 2021 as stronger Banks take advantage of opportunities with weaker performing Institutions as well as the potential for more IT and Fintech related partnerships.
- While the CECL deadline for Community Banks is not for a few years, Banks are recommended to prepare sooner rather than later and at a minimum have a conversion plan mapped out.
- It is recommended that Banks speak with their regulators before issuing dividends or buying back stock.
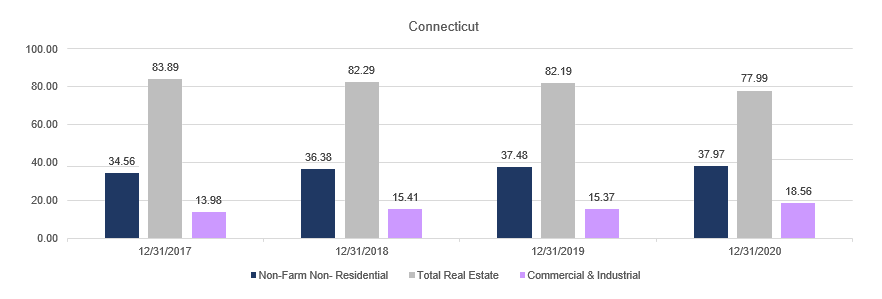
This chart covers all clients and presents the portfolio mix percentages for the client group. Clearly real estate is a major but declining component while the commercial & industrial is a growing group.
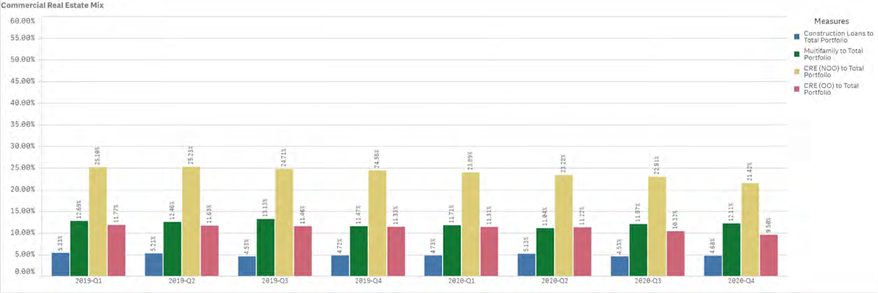
This chart covers all clients and presents the commercial real estate portfolio mix percentages for the client group. Non-owner occupied commercial real estate continues to comprise the largest concentration.
Loan Portfolio Mix
Loan and Lease Analysis
|
California |
3/31/2020 |
6/30/2020 |
9/30/2020 |
12/31/2020 |
|
Net Loss to Average Loans (%) |
0.10 |
0.09 |
0.09 |
0.08 |
|
Loss Provision to Average Loans (%) |
0.12 |
0.13 |
0.08 |
0.05 |
|
Ln&Ls Allowance to Total Ln&Ls (%) |
1.52 |
1.43 |
1.49 |
1.55 |
|
NonCurrent Ln&Ls to Total Ln&Ls (%) |
0.48 |
0.49 |
0.50 |
0.57 |
|
30-89 P/D to Total Ln&Ls (%) |
0.42 |
0.25 |
0.27 |
0.23 |
|
Ln&Ls Allowance to NA Ln&Ls (%) |
14.83 |
12.17 |
35.32 |
36.17 |
|
Connecticut |
3/31/2020 |
6/30/2020 |
9/30/2020 |
12/31/2020 |
|
Net Loss to Average Loans (%) |
0.23 |
0.23 |
0.21 |
0.21 |
|
Loss Provision to Average Loans (%) |
0.15 |
0.17 |
0.12 |
0.09 |
|
Ln&Ls Allowance to Total Ln&Ls (%) |
1.36 |
1.41 |
1.49 |
1.53 |
|
NonCurrent Ln&Ls to Total Ln&Ls (%) |
0.91 |
0.94 |
0.98 |
1.09 |
|
30-89 P/D to Total Ln&Ls (%) |
0.59 |
0.44 |
0.32 |
0.40 |
|
Ln&Ls Allowance to NA Ln&Ls (%) |
48.81 |
30.85 |
34.48 |
34.86 |
|
Florida |
3/31/2020 |
6/30/2020 |
9/30/2020 |
12/31/2020 |
|
Net Loss to Average Loans (%) |
0.09 |
0.09 |
0.10 |
0.10 |
|
Loss Provision to Average Loans (%) |
0.10 |
0.21 |
0.11 |
0.06 |
|
Ln&Ls Allowance to Total Ln&Ls (%) |
1.33 |
1.32 |
1.37 |
1.41 |
|
NonCurrent Ln&Ls to Total Ln&Ls (%) |
0.84 |
0.83 |
0.82 |
0.79 |
|
30-89 P/D to Total Ln&Ls (%) |
0.79 |
0.59 |
0.48 |
0.53 |
|
Ln&Ls Allowance to NA Ln&Ls (%) |
9.58 |
8.08 |
9.54 |
19.54 |
|
Massachusetts |
3/31/2020 |
6/30/2020 |
9/30/2020 |
12/31/2020 |
|
Net Loss to Average Loans (%) |
0.04 |
0.04 |
0.04 |
0.05 |
|
Loss Provision to Average Loans (%) |
0.08 |
0.09 |
0.05 |
0.05 |
|
Ln&Ls Allowance to Total Ln&Ls (%) |
1.03 |
1.05 |
1.09 |
1.14 |
|
NonCurrent Ln&Ls to Total Ln&Ls (%) |
0.52 |
0.54 |
0.59 |
0.58 |
|
30-89 P/D to Total Ln&Ls (%) |
0.49 |
0.26 |
0.23 |
0.27 |
|
Ln&Ls Allowance to NA Ln&Ls (%) |
8.31 |
7.16 |
20.18 |
4.20 |
|
New Jersey |
3/31/2020 |
6/30/2020 |
9/30/2020 |
12/31/2020 |
|
Net Loss to Average Loans (%) |
0.15 |
0.11 |
0.08 |
0.08 |
|
Loss Provision to Average Loans (%) |
0.11 |
0.09 |
0.05 |
0.03 |
|
Ln&Ls Allowance to Total Ln&Ls (%) |
1.12 |
1.08 |
1.14 |
1.16 |
|
NonCurrent Ln&Ls to Total Ln&Ls (%) |
0.78 |
0.86 |
0.87 |
0.92 |
|
30-89 P/D to Total Ln&Ls (%) |
0.71 |
0.50 |
0.42 |
0.57 |
|
Ln&Ls Allowance to NA Ln&Ls (%) |
2.41 |
2.86 |
3.39 |
3.88 |
|
New York |
3/31/2020 |
6/30/2020 |
9/30/2020 |
12/31/2020 |
|
Net Loss to Average Loans (%) |
0.08 |
0.07 |
0.07 |
0.08 |
|
Loss Provision to Average Loans (%) |
0.14 |
0.11 |
0.08 |
0.07 |
|
Ln&Ls Allowance to Total Ln&Ls (%) |
1.11 |
1.12 |
1.17 |
1.20 |
|
NonCurrent Ln&Ls to Total Ln&Ls (%) |
0.82 |
0.87 |
0.85 |
0.92 |
|
30-89 P/D to Total Ln&Ls (%) |
0.99 |
0.53 |
0.46 |
0.61 |
|
Ln&Ls Allowance to NA Ln&Ls (%) |
4.37 |
4.52 |
3.23 |
3.37 |
The following presents the trendline on criticized (Special Mention, Substandard, Doubtful) and classified (Substandard, Doubtful) loans relative to portfolio and Tier I Capital + LLR. The trendline indicates an increase in criticized and classified levels.
The following represents the number of clients in each of the noted ranges of percentage. The data addressing the classified (Substandard, Doubtful) segment shows that there is negative direction in the client group’s overall migration
|
Criticized / Portfolio |
3/31/2019 |
6/30/2019 |
9/30/2019 |
12/31/2019 |
3/31/2020 |
6/30/2020 |
9/30/2020 |
12/31/2020 |
|
0% to 1% |
16.95% |
13.56% |
16.98% |
13.46% |
12.50% |
10.20% |
12.00% |
12.24% |
|
1% to 2% |
33.90% |
32.20% |
24.53% |
26.92% |
27.08% |
26.53% |
26.00% |
22.45% |
|
2% to 3% |
20.34% |
23.73% |
24.53% |
26.92% |
29.17% |
28.57% |
22.00% |
24.49% |
|
3% to 4% |
13.56% |
13.56% |
13.21% |
19.23% |
16.67% |
20.41% |
24.00% |
22.45% |
|
4%+ |
15.25% |
16.95% |
20.75% |
13.46% |
14.58% |
14.29% |
16.00% |
18.37% |
|
Classified / Portfolio |
3/31/2019 |
6/30/2019 |
9/30/2019 |
12/31/2019 |
3/31/2020 |
6/30/2020 |
9/30/2020 |
12/31/2020 |
|
0% to 1% |
45.76% |
35.59% |
32.08% |
30.77% |
31.25% |
30.61% |
36.00% |
30.61% |
|
1% to 2% |
27.12% |
35.59% |
35.85% |
44.23% |
45.83% |
42.86% |
34.00% |
38.78% |
|
2% to 3% |
16.95% |
16.95% |
18.87% |
17.31% |
16.67% |
18.37% |
16.00% |
18.37% |
|
3% to 4% |
5.08% |
8.47% |
9.43% |
7.69% |
6.25% |
6.12% |
12.00% |
6.12% |
|
4%+ |
5.08% |
3.39% |
3.77% |
0.00% |
0.00% |
2.04% |
2.00% |
6.12% |
The following represents the number of clients in each of the noted ranges of percentage. The data addressing the overall criticized and the more specific classified segments shows that there is negative direction in the client group’s overall migration.
|
Criticized / Portfolio |
3/31/2019 |
6/30/2019 |
9/30/2019 |
12/31/2019 |
3/31/2020 |
6/30/2020 |
9/30/2020 |
12/31/2020 |
|
0% to 1% |
16.95% |
13.56% |
16.98% |
13.46% |
12.50% |
10.20% |
12.00% |
12.24% |
|
1% to 2% |
33.90% |
32.20% |
24.53% |
26.92% |
27.08% |
26.53% |
26.00% |
22.45% |
|
2% to 3% |
20.34% |
23.73% |
24.53% |
26.92% |
29.17% |
28.57% |
22.00% |
24.49% |
|
3% to 4% |
13.56% |
13.56% |
13.21% |
19.23% |
16.67% |
20.41% |
24.00% |
22.45% |
|
4%+ |
15.25% |
16.95% |
20.75% |
13.46% |
14.58% |
14.29% |
16.00% |
18.37% |
|
Classified / Portfolio |
3/31/2019 |
6/30/2019 |
9/30/2019 |
12/31/2019 |
3/31/2020 |
6/30/2020 |
9/30/2020 |
12/31/2020 |
|
0% to 1% |
45.76% |
35.59% |
32.08% |
30.77% |
31.25% |
30.61% |
36.00% |
30.61% |
|
1% to 2% |
27.12% |
35.59% |
35.85% |
44.23% |
45.83% |
42.86% |
34.00% |
38.78% |
|
2% to 3% |
16.95% |
16.95% |
18.87% |
17.31% |
16.67% |
18.37% |
16.00% |
18.37% |
|
3% to 4% |
5.08% |
8.47% |
9.43% |
7.69% |
6.25% |
6.12% |
12.00% |
6.12% |
|
4%+ |
5.08% |
3.39% |
3.77% |
0.00% |
0.00% |
2.04% |
2.00% |
6.12% |
Reserve Coverage
Non-Performing Loans
The following are patterns in statistics regarding variances in assigned risk ratings by the Bank versus CEIS. While there can be multiple influences in the results, when viewed in the overall, resulting variances are one indicator in the direction of risk.
The following are patterns in statistics regarding variances in assigned risk ratings by the Bank versus CEIS. While there can be multiple influences in the results, when viewed in the overall, resulting variances are one indicator in the direction of risk.
The following are CEIS’ estimates of the six-month outlook for assigned grades. The graphs show that since 4QE19, the level of uncertainty regarding the COVID impact on portfolios is clearly evident.
The following are the observations made regarding the financial trend of the borrowers. The graphs show that since 4QE19, the level of uncertainty regarding the COVID impact on borrowers is clearly evident.
The following represents the pattern on technical exception levels. The data shows a rise in the exception levels caused in part by the COVID environment impacting administrative priorities.
Covenant Compliance
New and Renewed
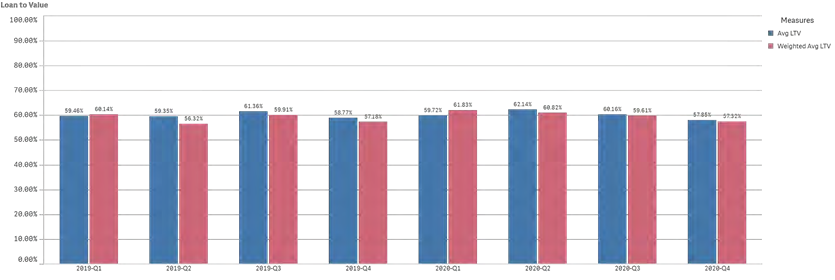
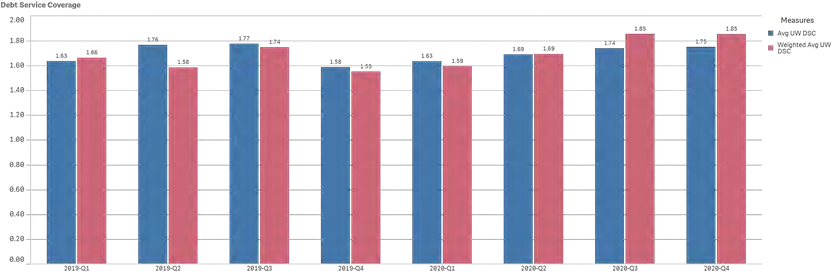
Loan to Value and Debt Service Coverage
Credit Policy Exception
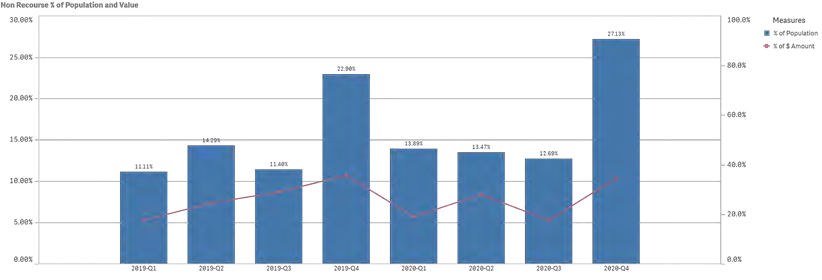
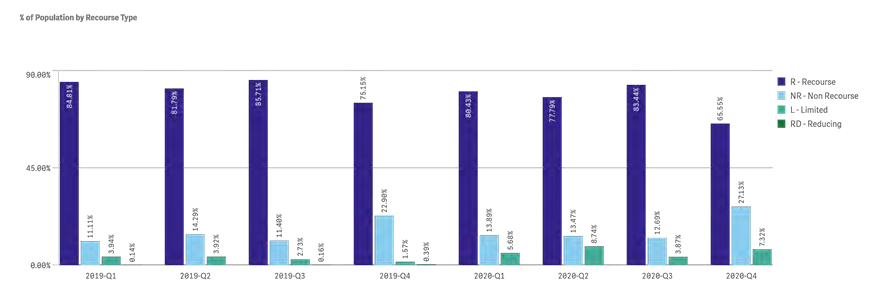
Non-Recourse
CEIS Review Inc. – Commercial Portfolio Advisory EST 1989
CEIS is an independent consulting firm established in 1989, serving the needs of organizations with general and/or specialized commercial loan portfolios.
Loan Review, ALLL / LLR Methodology and Validation, Portfolio Stress Testing, Portfolio Acquisition Review, Leveraged Lending Review, Municipal and Public Finance Review, Loan Policy Maintenance, Process Review, and Customized Loan and Credit Seminars.
(888) 967-7380

